Band 4.5 IELTS Writing Task 1 Model Answer
Overall Band Score: 4.5 · Cambridge IELTS 14 · 2026-11-16
IELTS Writing Task 1 question
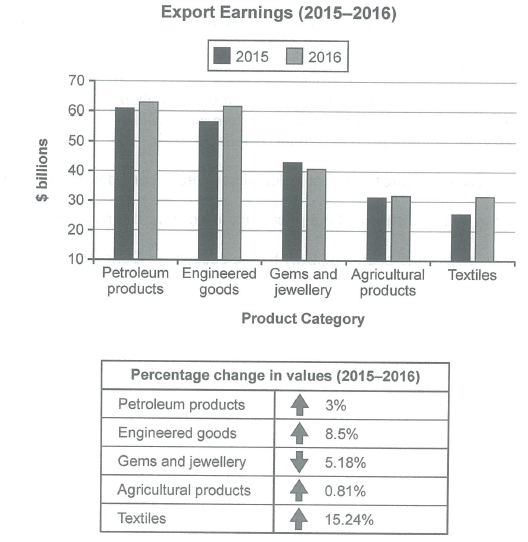
The chart below shows the value of one country’s exports in various categories during 2015 and 2016. The table shows the percentage change in each category of exports in 2016 compared with 2015.
Summarise the information by selecting and reporting the main features, and make comparisons where relevant.
Student answer (Band 4.5)
The bar graphs gives information about value of one country's exports in various categories during 2015 and 2016. the table are shows in billions doller.
the hieghts value is textiles and the lowest values in the graph that is agricultural products the petroleum product and gems and jewellery are almost similure.
the highest value in 2016 is petroleum that is 62 billions and the engineered good are 61 billions both are similure. the lowest value of product that is textiles it is 31 billions and the gems and jewellery are different rating.
In 2015 the engineered are lower then petroleum but in 2016 pertomleum and engineered are both similure. the argricultural products in 2015 to 2016 in the same pogession.
the percentage change in value in petrol 3percentage and engineed goods are 8.5percentage the gems and jewellery and the agriculter are not same postion but the gems are high value in the aggericuleral.
AI examiner evaluation
| Criterion | Band |
|---|---|
| Task Achievement / Task Response | 4.0 |
| Coherence and Cohesion | 4.5 |
| Lexical Resource | 5.0 |
| Grammatical Range and Accuracy | 4.5 |
| Overall | 4.5 |
Task Achievement / Task Response: Band 4.0
You identify several relevant categories and make some comparisons, such as petroleum being higher than engineered goods in 2015 and the two being similar in 2016. However, the response gives no clear overview of the main trends and contains important inaccuracies: agricultural products, not textiles, were the lowest category in 2015, while petroleum was the highest in both years. You also describe textiles as the lowest in 2016, although agricultural products and textiles were approximately equal. The table is only partly reported; the changes for agricultural products and textiles are omitted, and the decline in gems and jewellery is not clearly explained. The response is 143 words, below the 150-word minimum, with 10 words copied from the prompt excluded from the count. Add a concise overview and report the key figures accurately.
Coherence and Cohesion: Band 4.5
There is a basic sequence from an introduction to comparisons of the chart and then the percentage changes, so the reader can recognise the intended subject. However, the ideas are not arranged into clear, purposeful paragraphs, and the response does not progress from an overview to supporting details. Several statements are difficult to follow, particularly “the gems and jewellery are different rating” and “the gems are high value in the aggericuleral.” Connections between points are also limited; repeated use of “and” does not show whether figures are being contrasted or added. Group the information into an introduction, an overview, and detail paragraphs, and use clear comparisons such as “whereas” and “by contrast” to guide the reader.
Lexical Resource: Band 5.0
You use some task-related vocabulary, including “exports,” “percentage change,” “petroleum,” and “agricultural products,” which helps identify the chart’s subject. However, the range is limited and several inaccurate or misspelled expressions make the meaning harder to understand. Examples include “hieghts value,” “similure,” “pertomleum,” and “same pogession.” Some phrases are also imprecise, such as “different rating” and “the gems are high value in the aggericuleral.” Use standard category names consistently and choose precise language for increases, decreases, and comparisons. Proofreading spelling and replacing vague phrases with chart-specific terms would make your reporting clearer and more appropriate for an academic summary.
Grammatical Range and Accuracy: Band 4.5
The response attempts a few different sentence patterns, including comparisons across years, but most sentences rely on simple structures and frequent grammatical errors make some relationships unclear. For example, “The bar graphs gives information” has a subject–verb agreement error, while “the table are shows” combines incompatible verb forms. Articles and sentence boundaries are also inconsistent, as in “the highest value in 2016 is petroleum.” The past-year comparisons would be clearer with consistent past tense and complete clauses, for example, “In 2015, petroleum exports were higher than engineered goods.” Use shorter, complete sentences first, checking agreement, verb forms, articles, and punctuation before attempting more complex comparisons.
See this exact question answered at other band scores. The same prompt compared across bands.
Browse more IELTS Writing model answers or get your own writing scored by the same AI examiner.