Band 6.5 IELTS Writing Task 1 Model Answer
Overall Band Score: 6.5 · Cambridge IELTS 14 · 2026-11-17
IELTS Writing Task 1 question
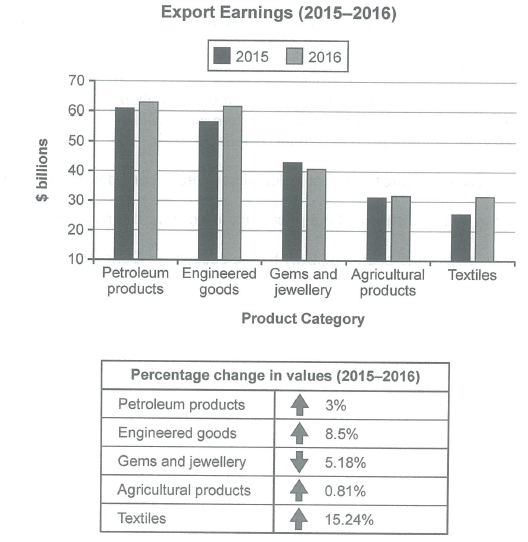
The chart below shows the value of one country’s exports in various categories during 2015 and 2016. The table shows the percentage change in each category of exports in 2016 compared with 2015.
Summarise the information by selecting and reporting the main features, and make comparisons where relevant.
Student answer (Band 6.5)
The given bar graph illustrates the export earning of a country in different fields over the period of 2015 and 2016,while the data table comparatively demonstrates the varying proportion in all categories of exports from 2015 to 2016.
Overall,almost all the sectors grew of over the time except the category of gems and jewellery was declined. In the product category table, textiles has the highest changing value ratio of 15.24%, however agricultural products has the lowest varying percentage of 0.81%.
The petroleum products has annual export earning about $61billion in 2015 which increased to $63billion. Similarly,engineered goods increased from in the next year $57billion to $62billion,while gems and jewellery export decreased from 43 to 41billion. Export of agricultural products is slightly increased by a single billion, although Textiles surged from $25billion to $32billion.
The table gives the information of alters in numbers between 2015 to 2016 more precisely. The total enhanced in petroleum products is about 3%,engineered goods has 8.5% increased, agricultural products has gradual increase of only 0.81% while textiles has rose steadily with 15.24. By contrast, gems and jewellery declined by 5.18%.
AI examiner evaluation
| Criterion | Band |
|---|---|
| Task Achievement / Task Response | 7.0 |
| Coherence and Cohesion | 6.5 |
| Lexical Resource | 6.0 |
| Grammatical Range and Accuracy | 5.5 |
| Overall | 6.5 |
Task Achievement / Task Response: Band 7.0
The response covers the main features and gives a clear overview: most categories rose, while gems and jewellery fell; it also identifies textiles as the fastest-growing category and agricultural products as the slowest. The figures are generally well selected and align with the chart, including petroleum at $61 billion and $63 billion and engineered goods rising from $57 billion to $62 billion. The table’s percentage changes are also reported accurately. There are small imprecisions in the detail: agricultural exports rose from about $31 billion to $31.5 billion, not by a full billion, and textiles were about $26 billion and $31.5 billion rather than $25 billion and $32 billion. These do not undermine the overall account, but closer precision would strengthen it.
Coherence and Cohesion: Band 6.5
The response has a clear four-part structure: introduction, overview, chart details, and table details. This gives the reader a logical route through the information, and contrasts such as “By contrast” help distinguish the decline in gems and jewellery from the increases elsewhere. The overview also usefully groups the main trends before the figures are presented. However, some links are awkward or repetitive, particularly “The table gives the information of alters in numbers” after the table has already been summarised. The long third paragraph also moves through all five categories without much grouping. To make progression smoother, organise the figures into clearer comparisons and use concise references to avoid repeating the table’s information.
Lexical Resource: Band 6.0
There is adequate vocabulary for describing the chart, including “increased,” “decreased,” “surged,” “highest,” and “lowest,” and the response uses some variation rather than relying on one verb throughout. However, several choices are inaccurate or unnatural for this task: “export earning” should be plural or expressed as “export earnings,” “varying proportion” does not describe the table’s percentage changes clearly, and “the total enhanced” is not an appropriate collocation. “Changing value ratio” is also unclear. These choices do not prevent the reader from understanding the main comparisons, but they limit precision. Prefer standard chart language such as “export revenue,” “percentage change,” and “rose by” or “fell by,” and check that each phrase describes the data accurately.
Grammatical Range and Accuracy: Band 5.5
The response attempts a mix of simple and complex sentences, including clauses introduced by “while,” “although,” and “By contrast.” The main trends are usually understandable, but some grammatical errors recur. For example, “the category of gems and jewellery was declined” uses an incorrect passive form; write “declined” or “fell.” In “engineered goods increased from in the next year $57billion to $62billion,” the word order and sentence structure are faulty. There are also agreement and article problems in “textiles has” and “The petroleum products has,” as well as missing spaces after commas and inconsistent punctuation. Practise accurate subject–verb agreement and straightforward comparative sentence patterns before adding more complex clauses.
See this exact question answered at other band scores. The same prompt compared across bands.
Browse more IELTS Writing model answers or get your own writing scored by the same AI examiner.