Band 6.0 IELTS Writing Task 1 Model Answer
Overall Band Score: 6.0 · Cambridge IELTS 14 · 2026-11-18
IELTS Writing Task 1 question
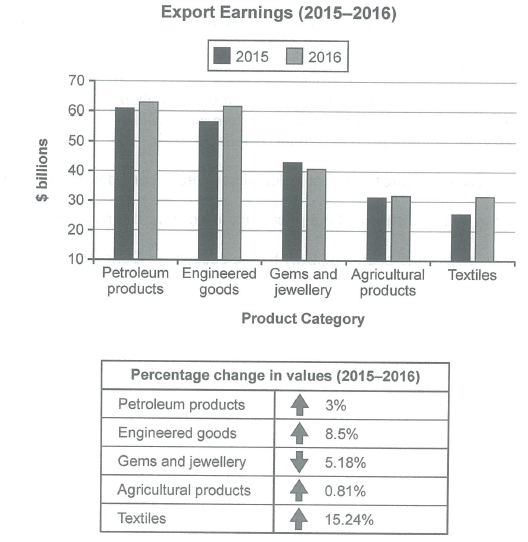
The chart below shows the value of one country’s exports in various categories during 2015 and 2016. The table shows the percentage change in each category of exports in 2016 compared with 2015.
Summarise the information by selecting and reporting the main features, and make comparisons where relevant.
Student answer (Band 6.0)
The value of one country's exports in different categories during 2015 and 2016 has been demonstrated in the bar chart; meanwhile, the table illustrates the variation in proportion of each category of export in 2015 compared with 2016.
Overall, petroleum products, and the engineering goods have made highest revenue. Moreover the textile products generated the least ratio of profit in 2015 as well as in 2016; meanwhile the table shows that the highest percentage change was seen in the category of textile.
The bar chart explains that the value petroleum products was the highest about 60 billion in 2015, while in 2016 the ratio was nearly 62 billion. Moreover the engineered goods made the revenue of 56 billion in 2015, and 61 billion in 2016, 42 billion was made by gems and jewelery in 2015, and 40 billion in 2015; meanwhile the proportion of agricultural good remains same during this time nearly 30 billion. The export of textile products made 26 billion in 2015, and 30 billion in 2016 same as agricultural products.
The table shows the percentage change in values of different categories.There was increase of 3% values of petroleum products, 8.5% in engineered goods, 0.81 in agricultural goods, and 15.4% in textile. Although the value of gems and jewellery decreases by 5.18%.
AI examiner evaluation
| Criterion | Band |
|---|---|
| Task Achievement / Task Response | 6.0 |
| Coherence and Cohesion | 6.0 |
| Lexical Resource | 5.5 |
| Grammatical Range and Accuracy | 5.5 |
| Overall | 6.0 |
Task Achievement / Task Response: Band 6.0
You cover the main categories and give a useful overview: petroleum and engineered goods were the highest earners, while textiles had the largest percentage increase. Most figures and trends are reported accurately, including the decline in gems and jewellery and the near-stability of agricultural exports. However, the overview is not fully precise: textiles were not the least profitable category in 2016, since agricultural products and textiles were both about $31.5 billion. There is also a clear data error where you say gems earned “40 billion in 2015”; this should refer to 2016. The comparison of the two leading categories and the significance of the similar 2016 values could be developed more clearly.
Coherence and Cohesion: Band 6.0
The response has a coherent overall arrangement, moving from an introduction and overview to chart details and then the table. This makes the information easy to follow in broad terms. However, some linking is mechanical or unclear, particularly the repeated use of “Moreover” and “meanwhile.” The long third paragraph also combines several categories in one sentence, making the comparison harder to track; for example, the gems figures and the agricultural trend are joined without clear separation. Use shorter, category-based comparisons and clearer references to distinguish increases, decreases and stable values. The final paragraph repeats information already given rather than adding a concise comparison of the table’s main pattern.
Lexical Resource: Band 5.5
You use relevant task vocabulary such as “percentage change,” “revenue,” “category” and “decreases,” and the reader can generally understand the comparisons. However, some word choices and collocations are inaccurate or unnatural, including “least ratio of profit,” “made the revenue,” and “variation in proportion,” which reduce precision. There are also inconsistent forms such as “engineered goods” and “engineering goods,” and “jewelery” is misspelled. Aim for standard chart language and use the same category labels as the visual. More precise verbs such as “generated,” “stood at” and “rose” would help you describe the figures naturally without relying on repeated or awkward phrases.
Grammatical Range and Accuracy: Band 5.5
You attempt both simple and more complex sentences, including clauses linked with “while” and “although,” and the overall meaning is usually clear. Some grammatical errors remain, however. In the opening, “has been demonstrated” is an awkward tense choice for describing a chart, and “the value petroleum products was” is missing a necessary grammatical link. The sentence beginning “42 billion was made by gems” also has unclear structure and repeats the year 2015 for the second figure. There are occasional article, number and punctuation problems, such as “There was increase” and missing spaces after full stops. Check sentence boundaries and make sure each comparison has a clear subject, verb and year.
See this exact question answered at other band scores. The same prompt compared across bands.
Browse more IELTS Writing model answers or get your own writing scored by the same AI examiner.