Band 5.5 IELTS Writing Task 1 Model Answer
Overall Band Score: 5.5 · Cambridge IELTS 14 · 2026-11-20
IELTS Writing Task 1 question
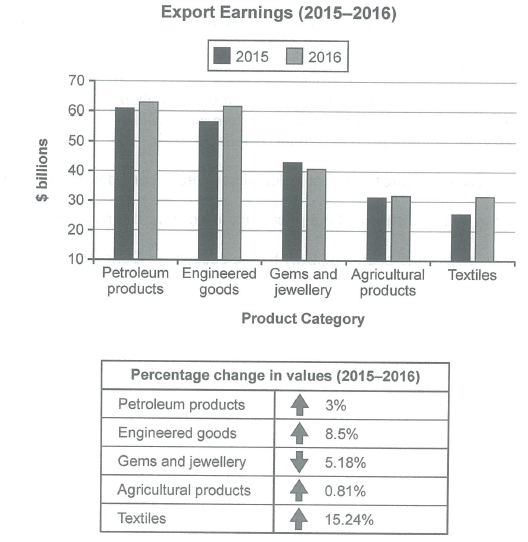
The chart below shows the value of one country’s exports in various categories during 2015 and 2016. The table shows the percentage change in each category of exports in 2016 compared with 2015.
Summarise the information by selecting and reporting the main features, and make comparisons where relevant.
Student answer (Band 5.5)
The bar graph isllustrate the value of one country's exports in various categories during the year 2015 and 2016, whereas table chart show the percentage chnage in each category during the followed year.
Overall, the contribution of petroleum product was remained higher in both the years, while Textiles proportinate lowest in all five categories. In contrast, percentage of petroleum product was lower as compared to textiles.
To begin with, in 2015, the country exports petroleum products at 40 billions dollar, whereas it increased to 2 points at $62 billions in 2016, 3% raised. Furthermore, the proportion of engineered goods was roughly at $58 billions, which increased to 61 billions dollar, follwed by 8.5% increment. The agricultural products was relatively similar in both ther years at approximately 30 to 31 billions dollar, percentage was 0.81% which was the lowest.
In addition, the figure of textile was lower at $25 billions in 2015, followed by nearly to $31 billions, but ther percentage shows the 15.24% inclined in just one year which was the highest in enitre products. In contrast, in 2015, gems and jewllery has been $42 billions, it declined to $40 billions, percentage reached at 5.18% decreased.
AI examiner evaluation
| Criterion | Band |
|---|---|
| Task Achievement / Task Response | 5.5 |
| Coherence and Cohesion | 6.0 |
| Lexical Resource | 5.5 |
| Grammatical Range and Accuracy | 5.0 |
| Overall | 5.5 |
Task Achievement / Task Response: Band 5.5
You identify the main categories and report several relevant changes, including textiles’ strongest percentage rise and the decline in gems and jewellery. However, some figures are substantially inaccurate: petroleum exports were about $61 billion in 2015, not $40 billion, and rose to about $63 billion; engineered goods were about $57 billion and $62 billion, rather than $58 billion and $61 billion. The overview also says textiles were the lowest in both years, but in 2016 agricultural products and textiles were approximately equal at $31.5 billion. The comparison that petroleum’s percentage change was lower than textiles’ is useful, but the overview should more accurately summarise the overall pattern and key extremes.
Coherence and Cohesion: Band 6.0
The response has a clear overall arrangement: an introduction, an overview, and two paragraphs covering the figures. Phrases such as “To begin with” and “In addition” help signal the progression, and the categories are generally grouped in a sensible way. However, some links between information are unclear or mechanical. For example, “whereas it increased to 2 points at $62 billions” makes the relationship between the starting value, the change, and the final value difficult to follow. The overview’s contrast about percentage changes is also not fully explained. Improve cohesion by presenting each category’s 2015 value, 2016 value, and percentage change in a consistent pattern, and use clearer references.
Lexical Resource: Band 5.5
You use relevant task vocabulary, including “percentage,” “declined,” “increased,” and “approximately,” and the reader can usually identify the intended comparisons. However, the range and control of collocations and word forms are limited, with noticeable errors such as “table chart,” “contribution … was remained higher,” “percentage … inclined,” and “in entire products.” Several spellings are also inaccurate, including “chnage,” “follwed,” and “jewllery,” which detract from precision. Aim for standard chart-reporting expressions such as “export earnings,” “rose by,” “accounted for,” and “the largest increase.” More accurate, natural phrasing would make the comparisons easier to understand.
Grammatical Range and Accuracy: Band 5.0
You attempt both simple and more complex sentences, including clauses joined with “whereas” and “which,” but errors in sentence structure and verb forms are frequent enough to affect clarity. Examples include “the bar graph isllustrate,” “table chart show,” and “the contribution … was remained higher”; these need correct subject–verb agreement and verb forms. There are also problems with articles, plurals, and prepositions in phrases such as “at 40 billions dollar” and “percentage reached at 5.18% decreased.” Some sentences combine several figures without a clear grammatical relationship. Practise accurate past-tense reporting and concise comparison structures, for example: “Petroleum exports rose from about $61 billion to $63 billion, an increase of 3%.”
See this exact question answered at other band scores. The same prompt compared across bands.
Browse more IELTS Writing model answers or get your own writing scored by the same AI examiner.