Band 5.5 IELTS Writing Task 1 Model Answer
Overall Band Score: 5.5 · Cambridge IELTS 14 · 2026-11-20
IELTS Writing Task 1 question
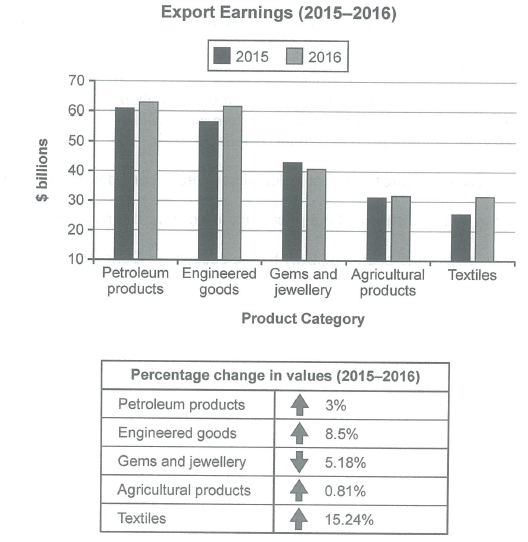
The chart below shows the value of one country’s exports in various categories during 2015 and 2016. The table shows the percentage change in each category of exports in 2016 compared with 2015.
Summarise the information by selecting and reporting the main features, and make comparisons where relevant.
Student answer (Band 5.5)
The bar graph illustrates the export earnings in 2015 to 2016 of one country's and below the table represent the fluctuation of percentage as comparison of both years.
The overall, bar graph summarize the difference of different categories in 2015 and 2016 according to the billions dollars and below the percentage tabel shows the changes of ratio [redacted phone] of various categories.
Firstly, Petroleum product in 2016 is slightly increase as compared to 2015, its earn roughly 62.99 billions dollar. Moreover, the Engineered goods also earn 60+ billions dollar within 1 year because in 2015 it's in uper 50 but below 60 billions dollar.
Gems and jewellery, is opposite and it fell down in 2016 as compared to the previous year in 2015 but not a huge difference. Furthermore, in Agricultural products within 1 year its get only maximum 1 billion more. In textile, its a direct difference of earning is 30+ within 1 year because in 2015 it's 20+.
Secondly, the percentage table shows that the Textile gain high percentage change in 2015 to 2016 is 15.24% and it's a highest change as compared to other categories. Then the Engineered goods gain 8.5% changes. Next the Petroleum products get 3% and Agricultural products touches only 0.81% but it's inverse the Gems and jewellery falls 5.18% in 2015 to 2016.
AI examiner evaluation
| Criterion | Band |
|---|---|
| Task Achievement / Task Response | 6.0 |
| Coherence and Cohesion | 5.5 |
| Lexical Resource | 5.5 |
| Grammatical Range and Accuracy | 5.0 |
| Overall | 5.5 |
Task Achievement / Task Response: Band 6.0
You cover both the bar chart and the percentage table, and identify several key patterns: textiles show the largest percentage rise, while gems and jewellery decline. The comparison that petroleum earnings rise slightly and agricultural earnings change very little is also relevant. However, some figures are inaccurate or unclear: petroleum is about $63 billion, not $62.99 as a precise figure, and textiles rise from about $26 billion to $31.5 billion, rather than simply being “20+” and “30+.” The statement that agricultural products gain “only maximum 1 billion” is imprecise. Your overview repeats that the visuals show differences and changes, but does not clearly summarise the main contrast between the highest-earning categories and the strongest growth. Select and compare the most important figures more explicitly.
Coherence and Cohesion: Band 5.5
The response has a recognisable structure: an introduction, a general statement, discussion of the chart, and then the table. Sequencing words such as “Firstly,” “Moreover,” and “Secondly” help signal movement between points. However, the first two paragraphs largely repeat the same general information, so the progression is not consistently clear. Within the chart paragraph, categories are listed one after another without a strong organising principle, and phrases such as “its a direct difference of earning” make the relationship between ideas difficult to follow. Grouping the categories by trend—for example, rising, falling, and nearly unchanged—would create clearer progression. Use linking expressions selectively and make references such as “it” and “its” unambiguous.
Lexical Resource: Band 5.5
You use relevant task vocabulary, including “export earnings,” “percentage change,” “categories,” and “fell,” and you distinguish increases from decreases. This gives you enough language to communicate the main trends. However, several word choices and collocations are unnatural or imprecise, such as “the table represent the fluctuation of percentage,” “gain high percentage change,” and “touches only 0.81%.” “Direct difference of earning” also does not clearly describe the increase in textile exports. Repetition of “difference,” “change,” and “earn” limits flexibility, while spelling errors such as “uper” and “tabel” reduce accuracy. Aim for standard chart-reporting phrases such as “recorded an increase,” “accounted for,” and “rose by,” and use “earnings” consistently for the values.
Grammatical Range and Accuracy: Band 5.0
You attempt both simple statements and longer sentences with comparisons, for example, “Gems and jewellery … fell down in 2016 as compared to the previous year.” The main trends are generally understandable, but some grammatical errors recur and occasionally make relationships unclear. The opening sentence, “The bar graph illustrates the export earnings in 2015 to 2016 of one country's,” has an incomplete and awkward structure. There are also problems with subject–verb agreement and verb forms, as in “the bar graph summarize” and “Petroleum product … is slightly increase.” Articles, plurals, and sentence boundaries need attention in phrases such as “the percentage tabel shows.” Practise accurate past-tense reporting and build longer sentences from a clear subject and verb.
See this exact question answered at other band scores. The same prompt compared across bands.
Browse more IELTS Writing model answers or get your own writing scored by the same AI examiner.