Band 6.0 IELTS Writing Task 1 Model Answer
Overall Band Score: 6.0 · Cambridge IELTS 14 · 2026-11-20
IELTS Writing Task 1 question
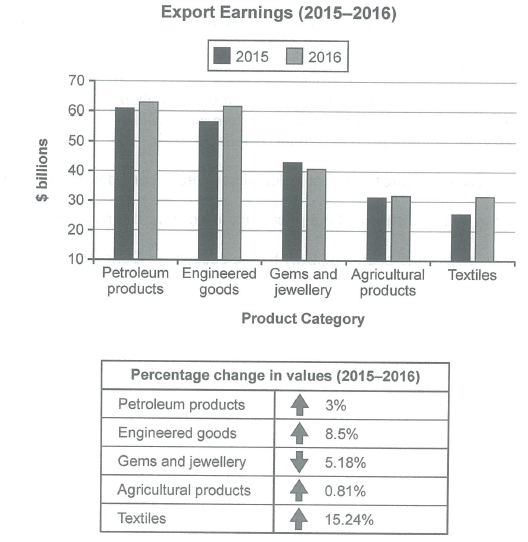
The chart below shows the value of one country’s exports in various categories during 2015 and 2016. The table shows the percentage change in each category of exports in 2016 compared with 2015.
Summarise the information by selecting and reporting the main features, and make comparisons where relevant.
Student answer (Band 6.0)
The bar chart illustrates the value of on country export in different items from 2015 to 2016. The table demonstrates the percentage modify in eacy category of exports.
Overall, export experienced increased in earning in almost all categories except gems and jewellery. Agricultural products remained stable in both years. In addition, Product categories followed similar trend percentage changes rose except germs and jewellery.
Looking at the bar chart in more detail, petroleum products recorded the highest exports 60billions in 2015 and just above 60billions in 2016, engineered goods was followed same trend, while textiles experienced the lowest export earning approximately at 25billions in 2015 and near 30billions in 2016. Agricultural products lewelled off in both years at around 30billions. Gems and jewellery decline gradually around 42billions to 40billions.
Regarding table, almost all categories value went up except gems and jewellery decrease. Textiles accounted for the highest percentage at 15.24%, whereas agricultural products had the smallest percentage at 3%. petroleum products stood at 3%. Engineered goods made up at 8.5%. Germ and jewellery fell at 5.18%.
AI examiner evaluation
| Criterion | Band |
|---|---|
| Task Achievement / Task Response | 6.5 |
| Coherence and Cohesion | 6.5 |
| Lexical Resource | 5.5 |
| Grammatical Range and Accuracy | 5.0 |
| Overall | 6.0 |
Task Achievement / Task Response: Band 6.5
You cover both the chart and the table, and your overview identifies the main pattern: most export values rose, while gems and jewellery fell. You also note that agricultural exports changed very little and correctly identify textiles as having the largest percentage increase. These features support a clear summary. Some details, however, are inaccurate: agricultural products had the smallest percentage change, 0.81%, not 3%; 3% belongs to petroleum products. The chart values are also slightly understated for some categories, though the broad comparisons remain sound. To strengthen the response further, report the key figures more precisely and make the overview’s comparison of the largest and smallest export categories clearer.
Coherence and Cohesion: Band 6.5
The response has a clear overall arrangement: an introduction, an overview, a paragraph describing the chart, and a final paragraph on the table. This makes the two visual elements easy to follow, and phrases such as “Looking at the bar chart in more detail” signal a change of focus. However, some links are awkward or unclear, particularly “Product categories followed similar trend percentage changes rose except germs and jewellery,” which combines ideas without a clear relationship. The final paragraph also lists figures in a somewhat repetitive sequence. Use more precise comparisons and connect related data within sentences—for example, contrast textiles’ strong rise with the slight change in agricultural products—to create smoother progression.
Lexical Resource: Band 5.5
You use relevant task vocabulary, including “exports,” “percentage,” “highest,” “lowest,” and “remained stable,” and the reader can generally understand the comparisons. However, several noticeable word-choice, spelling, and collocation problems limit precision: “percentage modify” is not an appropriate phrase, “on country” is incorrect, and “germs” is used instead of “gems.” Some expressions, such as “experienced increased in earning” and “made up at 8.5%,” are unnatural. Aim for accurate, conventional chart language such as “export earnings increased,” “the percentage change,” and “accounted for.” Check spelling of category names carefully, since errors can make data descriptions confusing.
Grammatical Range and Accuracy: Band 5.0
You attempt both simple and more complex sentence forms, and the response is divided into paragraphs that help convey the main points. However, grammatical errors occur across the response and sometimes make relationships between ideas difficult to follow. Examples include “export experienced increased in earning,” “engineered goods was followed same trend,” and “Gems and jewellery decline gradually,” where verb forms, agreement, or sentence construction are faulty. Articles and plural forms also need attention in phrases such as “the highest exports 60billions.” Practise building complete sentences with a clear subject and finite verb, and check tense consistency when describing the two years. More accurate sentence patterns would make your comparisons easier to understand.
See this exact question answered at other band scores. The same prompt compared across bands.
Browse more IELTS Writing model answers or get your own writing scored by the same AI examiner.