Band 5.5 IELTS Writing Task 1 Model Answer
Overall Band Score: 5.5 · Cambridge IELTS 14 · 2026-11-22
IELTS Writing Task 1 question
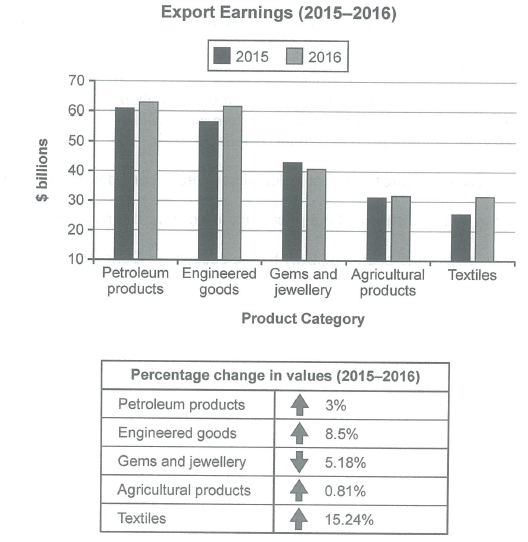
The chart below shows the value of one country’s exports in various categories during 2015 and 2016. The table shows the percentage change in each category of exports in 2016 compared with 2015.
Summarise the information by selecting and reporting the main features, and make comparisons where relevant.
Student answer (Band 5.5)
In given chart below shows the exports earning of one country in various categories during 2015 and 2016. In the table there is Petroleum, Engineered goods , Gems and jwellery, Agricultural products and Textiles data given during the year 2015 and 2016. Petroleum is the one which exports at high level at approx 60 billion follows by Engineered goods and at last there is Textiles exports which is at low level at approx 30 billion.
Firstly we can see the export of petroleum in 2015 roughly at 60 billion in 2016 it increases by 3 % it goes around at 64 billion. On the other hand which is Engineered goods as similar to Petroleum but slightly at low level in 2015 around at 55 billion but in 2016 it crosses the bar of 60 billion. It increases by 8.5% .
Gems and jwellery are the only one which goes downward over the year . In 2015 Gold and jwellery around at 45 billion and it reduce to nearly 40 billion almost 5.28 %. Agricultural products almost at same level with the increasement of 0.81 %. In 2015 Agricultural products at 32 billion it slightly improves around at 33 billion which is 0.81%.
Textiles are the only one which increase at high level among these all . In 2015 textiles exports around 25 billion but in 2016 it increases by 15.24% almost 33 billion which is great enhance in the exports of textiles.
AI examiner evaluation
| Criterion | Band |
|---|---|
| Task Achievement / Task Response | 5.5 |
| Coherence and Cohesion | 5.5 |
| Lexical Resource | 5.5 |
| Grammatical Range and Accuracy | 5.5 |
| Overall | 5.5 |
Task Achievement / Task Response: Band 5.5
You identify the main categories and report several important trends: petroleum and engineered goods are the highest earners, gems and jewellery decline, and textiles show the strongest growth. However, the overview is not fully clear or consistently accurate. Textiles are the lowest category in 2015, but agricultural products and textiles are both about $31.5 billion in 2016, so describing textiles as still “at low level” misses this comparison. There are also factual inaccuracies: gems and jewellery fall by 5.18%, not 5.28%, and agricultural exports rise only slightly, from about $31 billion to $31.5 billion, rather than to $33 billion. A clearer overview and more precise reporting of the figures would strengthen the response.
Coherence and Cohesion: Band 5.5
The response has a recognisable sequence: an opening, discussion of the leading categories, then the remaining categories. Paragraph breaks help separate these points, and phrases such as “On the other hand” and “Firstly” signal movement between ideas. However, the progression is sometimes repetitive and the opening mixes an overview with a list of categories. Some links are awkward or unclear, as in “On the other hand which is Engineered goods,” while “Textiles are the only one which increase at high level” repeats a point already introduced. Grouping the categories more deliberately—for example, the two leading earners together, followed by the declining and lower-value categories—would make comparisons easier to follow. Use linking expressions selectively and ensure each paragraph has a clear purpose.
Lexical Resource: Band 5.5
You use relevant task vocabulary, including “exports,” “increases,” “downward,” and “percentage,” and the reader can generally understand the comparisons you intend. However, several word choices and collocations are inaccurate or unnatural, which limits precision. “Exports earning” would be better expressed as “export earnings,” and “great enhance” does not naturally describe a rise in value. There are also spelling errors in “jwellery,” and “increasement” is not the appropriate noun here. Repeated use of “around,” “level,” and “increases” makes the description less varied. Build a small set of accurate chart-reporting expressions, such as “stood at,” “rose to,” “recorded the largest increase,” and “declined by,” and check spelling carefully.
Grammatical Range and Accuracy: Band 5.5
You attempt both simple statements and longer comparisons, and the main message is usually understandable. However, sentence structures are often incomplete or inaccurately formed. For example, “In given chart below shows” lacks a clear grammatical subject, and “Petroleum is the one which exports at high level” has an unclear structure. Tense and agreement also need attention: “it reduce” should be “it reduced,” while “Textiles are the only one” does not agree in number. Articles and prepositions are frequently missing or misplaced, as in “in 2015 roughly at 60 billion.” Practise forming complete sentences with a clear subject and verb, then check agreement, past-tense forms, and article use. More accurate control of these patterns would make the comparisons easier to read.
See this exact question answered at other band scores. The same prompt compared across bands.
Browse more IELTS Writing model answers or get your own writing scored by the same AI examiner.