Band 5.0 IELTS Writing Task 1 Model Answer
Overall Band Score: 5.0 · Cambridge IELTS 14 · 2026-11-22
IELTS Writing Task 1 question
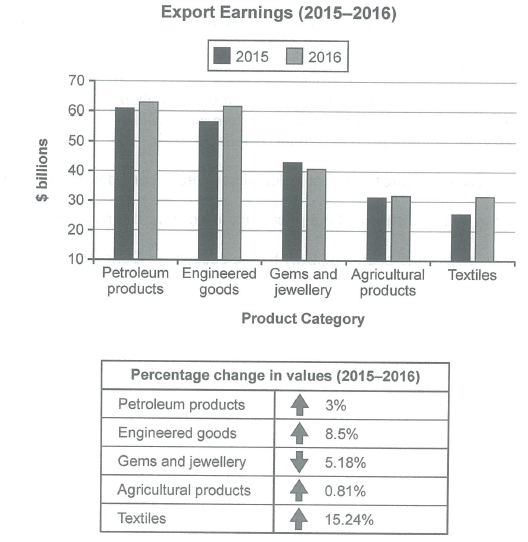
The chart below shows the value of one country’s exports in various categories during 2015 and 2016. The table shows the percentage change in each category of exports in 2016 compared with 2015.
Summarise the information by selecting and reporting the main features, and make comparisons where relevant.
Student answer (Band 5.0)
The given chart illistrate the value of exports in various categories during 2015 and 2016 of one countrys,furthemore given table presents the change in each category percentage of exports in 2016
overall, in the given chart petroleum products has the higest amount in export earnings in between both 2015 and 2016, textiles less among all five export earnings in both 2015 and 2016, In 2015 - 2016 percentage change in value shows that textiles gain 15.24 percentage of rise and gems and jewellery is only one product which is declining in value.
according to chart petroleum products has more then 60 billions in revenu in both years,engineered goods
AI examiner evaluation
| Criterion | Band |
|---|---|
| Task Achievement / Task Response | 5.0 |
| Coherence and Cohesion | 4.5 |
| Lexical Resource | 5.5 |
| Grammatical Range and Accuracy | 4.5 |
| Overall | 5.0 |
Task Achievement / Task Response: Band 5.0
You identify several important features accurately: petroleum products are the highest-earning category in both years, textiles show the largest increase, and gems and jewellery is the only category to decline. However, the report is incomplete and addresses the data only partially. It stops after beginning a point about engineered goods, so it gives no full comparison of the categories or account of most figures; the chart values for gems, agriculture and textiles are not reported. The overview is useful but could be supported with key figures, such as petroleum rising from about $61 billion to $63 billion and textiles from $26 billion to $31.5 billion. The response is 100 words, below the required 150, which limits the detail and coverage possible.
Coherence and Cohesion: Band 4.5
There is a basic attempt to organise the response: an opening sentence introduces the visuals, followed by an overview and then the start of a detail paragraph. The overview also groups the highest and lowest categories and identifies the main percentage-change pattern. However, progression is weak because the final paragraph ends abruptly after “engineered goods,” leaving the comparison unfinished. The opening and overview are crowded into long, loosely connected sentences, and transitions between the chart and table are not clearly managed. Use separate, complete paragraphs for the introduction, overview and key details, then connect comparisons with clear links such as “by contrast” or “while.”
Lexical Resource: Band 5.5
You use some relevant task vocabulary, including “export earnings,” “percentage change,” “declining in value” and “both years,” which helps communicate the topic. There is also an attempt to describe ranking with “highest” and “less among all five.” However, spelling and word-choice errors are noticeable, including “illistrate,” “higest,” “revenu” and “gain 15.24 percentage of rise.” Some expressions are also imprecise or unnatural, such as “textiles less among all five export earnings.” These choices sometimes make the meaning harder to follow. Build a more accurate range for describing figures and trends, for example “recorded the lowest earnings,” “rose by 15.24%,” and “export revenue.”
Grammatical Range and Accuracy: Band 4.5
The response attempts to combine information in longer sentences, and the main trend statements are generally understandable. However, sentence structures are limited and frequently inaccurate. For example, “petroleum products has” has a subject–verb agreement error, while “textiles less among all five export earnings” lacks a complete grammatical structure. The opening sentence also joins several ideas without clear punctuation, and the final sentence is incomplete. Articles, possessives and sentence boundaries need more consistent control. Practise writing complete sentences with a clear subject and verb, and use a full stop when moving from the chart description to the table summary. More accurate simple sentences would improve clarity before adding complex structures.
See this exact question answered at other band scores. The same prompt compared across bands.
Browse more IELTS Writing model answers or get your own writing scored by the same AI examiner.