Band 5.5 IELTS Writing Task 1 Model Answer
Overall Band Score: 5.5 · Cambridge IELTS 11 · 2026-11-06
IELTS Writing Task 1 question
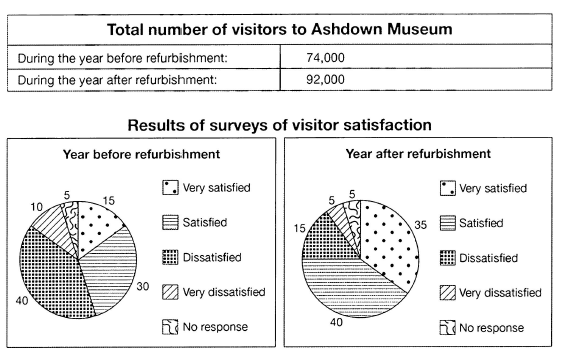
The table below shows the numbers of visitors to Ashdown Museum during the year before and the year after it was refurbished. The charts show the result of surveys asking visitors how satisfied they were with their visit, during the same two periods.
Summarise the information by selecting and reporting the main features, and make comparisons where relevant.
Student answer (Band 5.5)
The given table chart illustartes the information about number of visitors to Ashdown Museum during the year before and the year after and pei charts gives propotion of results of surveys of visitor satisfaction.The given data are measured in numbers.
Overall,the number of total visitors are highest after the refurbishment whereas, majority of people were diddatisfied in before refurbishment and most of the people were satisfied in after refurbishment.
In table chart,92,000 visitors were attracted in Ashdown Museum during the after refurbishment and in contrast, 74,000 visitors were visit Ashdown Museum during the year before refurbishment which was lowere then after development.
in pie chart, year of before refurbishment the majority people were dissatisfied according to survey almost 40% visitors,whereas only 5% visitor were give no response which was lowest recorded survey, aprtfrom this less than 10% of dissatisfied visitors were satisfied.10% and 15% visitors were very dissatisfied and very satisfied.
After refurbishment, most of the visitors were satisfied with development almost 40% visitors recoorded as surveys and 5% less than visiotors were very satisfied whereas 15% visitors were diddatisfied and only 5% visitors were very dissatisfied and no response according to survey.
In conclusion,major diffrence noticed in dissatisfied and satisfied among visitors in before and after refurbishment and same survey recorded in no response in survey.
AI examiner evaluation
| Criterion | Band |
|---|---|
| Task Achievement / Task Response | 6.0 |
| Coherence and Cohesion | 6.0 |
| Lexical Resource | 5.0 |
| Grammatical Range and Accuracy | 5.0 |
| Overall | 5.5 |
Task Achievement / Task Response: Band 6.0
You cover both the visitor totals and the satisfaction surveys, and your overview identifies the main changes: attendance rose after refurbishment, while dissatisfaction gave way to satisfaction. Most figures are reported accurately, including 74,000 and 92,000 visitors and the 40% dissatisfied share before refurbishment. However, some details are unclear or inaccurate: before refurbishment, 30% were satisfied, not “less than 10%”; after refurbishment, 35% were very satisfied, rather than “5% less than” visitors. The overview also says “majority” were dissatisfied before, although 40% is the largest group, not a majority. Develop the comparisons more precisely and distinguish the largest category from more than half of respondents.
Coherence and Cohesion: Band 6.0
The response has a recognisable structure: an introduction, an overview, separate descriptions of the table and charts, and a concluding sentence. This gives the reader a coherent overall route through the information. You also use comparison signals such as “whereas” and “in contrast” to connect changes across the two periods. However, some links are mechanical or confusing, and the final conclusion repeats the overview rather than adding a clear comparison. The long chart-description sentences combine several figures without clear separation, making relationships harder to follow. Use one focused paragraph for each period or satisfaction pattern, and make each sentence compare a small number of related categories. Check punctuation around linking words to make the progression smoother.
Lexical Resource: Band 5.0
You use relevant task vocabulary, including “refurbishment,” “visitors,” “survey,” “satisfied,” and “dissatisfied,” so the topic is generally clear. There is also some attempt to vary expression with phrases such as “in contrast” and “major difference.” However, spelling and word-choice errors are noticeable and sometimes make the meaning difficult to interpret: “pei charts,” “propotion,” “diddatisfied,” and “recoorded” are examples. Some combinations are also unnatural, such as “visitors were visit” and “satisfied with development.” Use standard chart terms such as “pie charts,” and choose precise reporting phrases like “accounted for” or “the proportion of respondents.” Careful proofreading of spelling and collocations would make your descriptions more reliable.
Grammatical Range and Accuracy: Band 5.0
You attempt both simple statements and longer sentences with contrast clauses, for example, “whereas only 5%…” This shows some range, and the main message is usually recoverable. However, errors in sentence structure, agreement, articles, and verb forms recur. For instance, “the number of total visitors are highest” needs singular agreement, while “visitors were visit” uses an incorrect verb form. Phrases such as “in the year before refurbishment the majority people” also need grammatical words and clearer construction. Punctuation is inconsistent, with missing spaces after commas and full stops, and some sentences run several ideas together. Practise accurate basic sentence patterns first, then add subordinate clauses while checking agreement and verb forms.
See this exact question answered at other band scores. The same prompt compared across bands.
Browse more IELTS Writing model answers or get your own writing scored by the same AI examiner.