Band 5.0 IELTS Writing Task 1 Model Answer
Overall Band Score: 5.0 · Cambridge IELTS 11 · 2026-11-06
IELTS Writing Task 1 question
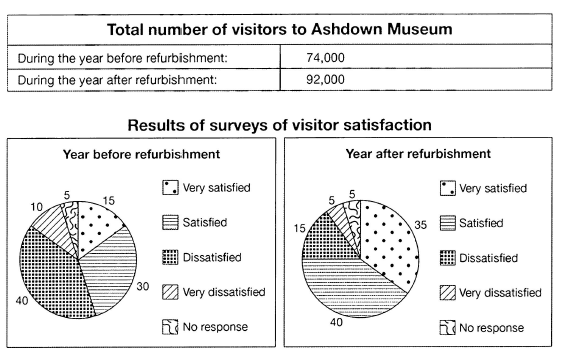
The table below shows the numbers of visitors to Ashdown Museum during the year before and the year after it was refurbished. The charts show the result of surveys asking visitors how satisfied they were with their visit, during the same two periods.
Summarise the information by selecting and reporting the main features, and make comparisons where relevant.
Student answer (Band 5.0)
The given table elucidates information about total number of visitors to ashdown museum . The chart compares the data in number or percentage . Overall it is clear that there are noticeable differences among the categories shown in the table . According to the table results of surveys of visitors satisfaction year before refurbishment very satisfied is 15 , statisfied is 30 , Dissatisfied is 40, very dissatisfied is 10 and no response is 5 . The total number of visitors to ashdown museum during the year before refurbishment is total 74000 . The result of surveys of visitors satisfaction year after refurbishment very satisfied is 35 , satisfied is 40 , dissatisfied is 15 , very dissatisfied is 5 and no response is 5 . The total number of visitors to ashdown museum during the year after refurbishment is total 92000 . The table shows the number of visitors to ashdown museum during the year before and the year after it was refurbished .
AI examiner evaluation
| Criterion | Band |
|---|---|
| Task Achievement / Task Response | 4.5 |
| Coherence and Cohesion | 4.5 |
| Lexical Resource | 5.5 |
| Grammatical Range and Accuracy | 5.0 |
| Overall | 5.0 |
Task Achievement / Task Response: Band 4.5
You include the main figures for both survey periods and visitor totals, and these match the data: visitors rose from 74,000 to 92,000, while satisfaction increased overall. However, the response mostly lists figures rather than summarising the key patterns. It needs a clear overview—for example, that dissatisfaction was more common before refurbishment, whereas satisfaction became more common afterwards—and relevant comparisons between categories. The opening claim about “noticeable differences” is too general, and the final sentence repeats information already given. The response is also below the required 150 words: 33 words copied from the task prompt are excluded from the count. Develop the overview and comparisons rather than adding repeated descriptions.
Coherence and Cohesion: Band 4.5
The response follows a basic before-and-after order, so the reader can identify which figures belong to each period. However, it is presented as one long paragraph, with little sense of progression from an introduction to an overview and then supporting details. Linking and reference are also limited: repeated phrases such as “The result of surveys of visitors satisfaction” make the writing cumbersome, while “the chart” and “the table” are not used consistently to guide the reader through the different visuals. Group the information into clear paragraphs and organise the survey results by comparison—for instance, contrast the satisfaction categories with the dissatisfaction categories—rather than listing each period separately.
Lexical Resource: Band 5.5
You use some task-relevant vocabulary, including “refurbishment,” “total number of visitors,” and the satisfaction categories, which allows the main subject to be understood. There is also an attempt at a more formal reporting verb in “elucidates.” However, the vocabulary is repetitive and some choices are inaccurate or awkward: “compares the data in number or percentage” is unclear, and “results of surveys of visitors satisfaction” is not a natural collocation. Spelling errors such as “statisified” (intended as “satisfied”) also reduce accuracy. Aim for precise chart language such as “the table reports visitor numbers” and “the proportion of respondents who were dissatisfied fell.”
Grammatical Range and Accuracy: Band 5.0
You attempt a few sentence forms, including an opening sentence and sentences that report figures, and the reader can generally understand the information. However, most of the response relies on repetitive, list-like structures, so the range is limited. Several sentences lack necessary articles or grammatical links, as in “total number of visitors to ashdown museum” and “year before refurbishment very satisfied is 15.” The sentence “The chart compares the data in number or percentage” is also structurally unclear. Capitalisation and spacing around punctuation are inconsistent, as in “museum .” Work on complete reporting clauses, articles, and sentence boundaries; for example, “Before refurbishment, 40% of respondents were dissatisfied.”
See this exact question answered at other band scores. The same prompt compared across bands.
Browse more IELTS Writing model answers or get your own writing scored by the same AI examiner.