Band 5.5 IELTS Writing Task 1 Model Answer
Overall Band Score: 5.5 · Cambridge IELTS 11 · 2026-11-06
IELTS Writing Task 1 question
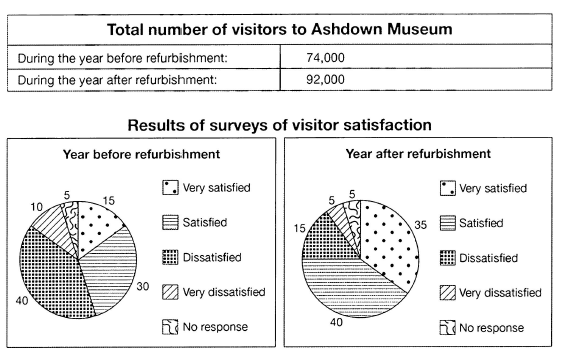
The table below shows the numbers of visitors to Ashdown Museum during the year before and the year after it was refurbished. The charts show the result of surveys asking visitors how satisfied they were with their visit, during the same two periods.
Summarise the information by selecting and reporting the main features, and make comparisons where relevant.
Student answer (Band 5.5)
There is an Information about the satisfation level of vistors who vistis the ashdown museum. Graph shows the comparison stats between before and after refurbishment.
Two different type of charts are given one is a pi chart and second one is a table. chart shows the satisfaction level amoung the the vistors before and after refurbishment and table show the number of visiitors.
We can see the significant increase in the number of visitors. Only 7400 people vists before upgradation but the number increase when development compleated 92000 persons vists after upgradation.
In the chart change occur in satisfaction level is clearly visible. before refurbishment majoiry portion is holded by disatisfied vistors. 30 percent satisfied ones and 40 percent are disatisfied from the museum on the other hand, after development graph twisted by almost 360. Very satifeid ones increase to 35 percent and 40 percent are satisfied only very few number like 5 to 15 percent is disatisfied which can eaisly be ignored
AI examiner evaluation
| Criterion | Band |
|---|---|
| Task Achievement / Task Response | 5.5 |
| Coherence and Cohesion | 5.5 |
| Lexical Resource | 5.0 |
| Grammatical Range and Accuracy | 5.0 |
| Overall | 5.5 |
Task Achievement / Task Response: Band 5.5
You identify the main overall changes: visitor numbers rose after refurbishment, and satisfaction shifted towards more positive responses. Several figures are reported accurately, including 30% satisfied and 40% dissatisfied before, and 35% very satisfied and 40% satisfied afterwards. However, the visitor total before refurbishment is given as 7,400 rather than 74,000, and the claim that dissatisfaction rose from 5% to 15% reverses the chart: it fell from 40% to 15%. The overview is also not clearly separated from the details, and the response omits the 5% no-response figures and the change in very dissatisfied visitors. To strengthen the report, give a concise, accurate overview and compare the main categories systematically, avoiding unsupported claims such as dissatisfaction being negligible.
Coherence and Cohesion: Band 5.5
The response has some organisation: it begins with an introduction, then discusses visitor numbers and satisfaction, and uses contrasts such as “on the other hand.” This gives the reader a basic sense of the two periods being compared. However, progression is not consistently clear. The opening repeats the chart description, while the final paragraph combines several figures and interpretations without a clear sequence. References such as “the chart” and “after development graph” are sometimes vague, and the transition “graph twisted by almost 360” does not clearly explain the comparison. Use distinct paragraphs for an overview and the key details, and group the satisfaction figures by period or by positive and negative responses. More precise linking would make the comparisons easier to follow.
Lexical Resource: Band 5.0
You attempt some task-relevant vocabulary, including “significant increase,” “satisfaction level,” “refurbishment,” and “comparison.” However, the range is limited and several word choices or collocations make the report difficult to interpret. For example, “graph twisted by almost 360” is not an appropriate way to describe a change in survey results, and “majority portion is holded by” is unclear. There are also frequent spelling errors, such as “satisfation,” “vistors,” “disatisfied,” and “eaisly,” which reduce clarity. Aim for standard chart language and accurate spelling: describe figures as percentages, say that a category “accounted for” a share, and use “increased” or “fell” for changes. Avoid informal or figurative expressions in an academic summary.
Grammatical Range and Accuracy: Band 5.0
The response attempts both simple and longer sentences, including a contrast between the two survey periods, but control is inconsistent. Errors in sentence structure and verb forms appear in examples such as “There is an Information,” “Only 7400 people vists,” and “the number increase when development compleated.” Articles, agreement, and tense need particular attention; for instance, “table show” should have a plural subject, and past events should generally be described in the past tense. Punctuation and capitalisation are also unreliable, with several sentences beginning in lowercase and the final sentence lacking a full stop. Build accuracy first with clear subject–verb sentences, then combine ideas using correctly formed clauses such as “After refurbishment, visitor numbers increased to 92,000.”
See this exact question answered at other band scores. The same prompt compared across bands.
Browse more IELTS Writing model answers or get your own writing scored by the same AI examiner.