Band 6.0 IELTS Writing Task 1 Model Answer
Overall Band Score: 6.0 · Cambridge IELTS 11 · 2026-11-06
IELTS Writing Task 1 question
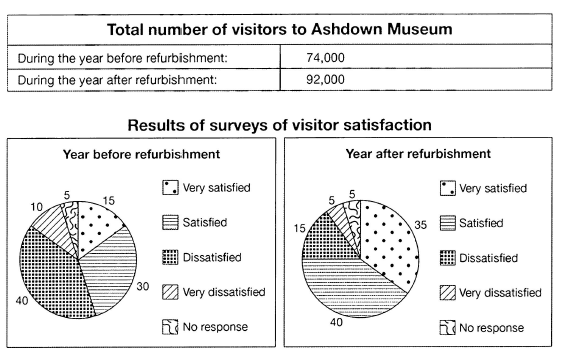
The table below shows the numbers of visitors to Ashdown Museum during the year before and the year after it was refurbished. The charts show the result of surveys asking visitors how satisfied they were with their visit, during the same two periods.
Summarise the information by selecting and reporting the main features, and make comparisons where relevant.
Student answer (Band 6.0)
The table shows the total number tourists to a specific museum prior to and following the renovation on annual basis.whereas the pie charts shows the total proportions of the feedback of how satisfied the visitors were.
Overall, the total number of visitors increased during the year following modernization,along with the major shift of the people's response.before more visitors were dissatisfied with Ashdown Museum while after refurbishment a major proportion of people were satisfied.
The total number of visitors before the renovation of the museum were 74000, of which a major proportion was not satisfied that is 40% of the visitors were not satisfied and another 10% deely unhappy making around half of the visitors. int he remaining half 5 % chose not to give any opinion while 30% were satisfied along with 15% of people who were very happy with the museum.
The year after the refurbishment saw an increase in visitors that is from 74000 to 92000. Also the survey results also changed, about one third of the tourists were happy with 35% within them being very happy,15% were not impressed and the 5% were very unhapy while the ratio for no response remained same that is 5%.
AI examiner evaluation
| Criterion | Band |
|---|---|
| Task Achievement / Task Response | 6.5 |
| Coherence and Cohesion | 6.0 |
| Lexical Resource | 5.5 |
| Grammatical Range and Accuracy | 5.5 |
| Overall | 6.0 |
Task Achievement / Task Response: Band 6.5
You cover both the visitor total and the satisfaction surveys, and your overview identifies the two main changes: attendance rose from 74,000 to 92,000, while responses shifted from mostly dissatisfied before the work to mostly satisfied afterwards. Most figures are reported accurately, including the unchanged 5% with no response. This gives the report a clear, relevant account of the data. To make the summary more fully developed, clarify the after-refurbishment figures: 35% were very satisfied and 40% satisfied, so 75% were satisfied overall; your phrase “about one third ... were happy” is unclear and understates this combined result. Also distinguish the 40% dissatisfied from the separate 10% very dissatisfied category rather than describing both simply as “not satisfied.” These refinements would make the comparisons more precise.
Coherence and Cohesion: Band 6.0
The response has a sensible overall structure: an introduction, an overview, and separate paragraphs for the two survey periods. The progression from the pre-refurbishment results to the post-refurbishment results is easy to follow, and linking phrases such as “Overall,” “while,” and “The year after” help signal comparisons. However, some connections are mechanical or unclear. For example, “Also the survey results also changed” repeats the linking word, and the long sentence beginning “The total number of visitors before...” packs several figures together without clear separation. Improve cohesion by grouping satisfaction categories consistently and using precise references such as “the corresponding figure” or “by contrast.” Careful punctuation and spacing would also make the paragraph boundaries and relationships easier to read.
Lexical Resource: Band 5.5
You use relevant vocabulary for describing the charts, including “increased,” “proportion,” “dissatisfied,” and “refurbishment,” and you attempt some variation with “renovation” and “modernization.” However, several choices are imprecise or unnatural for this report: “total number tourists,” “feedback of how satisfied,” and “deely unhappy” weaken clarity. “Happy” and “unhappy” are also less suitable than the chart’s satisfaction categories, especially when comparing survey responses. Spelling errors such as “int he” and “unhapy” further reduce accuracy. Aim for consistent, chart-appropriate terms—“visitors,” “satisfaction ratings,” and “very dissatisfied”—and check spelling and collocations during revision. This would make your vocabulary more precise and controlled.
Grammatical Range and Accuracy: Band 5.5
You attempt a mix of sentence forms, including a contrast in “before more visitors were dissatisfied ... while after refurbishment...” and a relative clause in “35% within them being very happy.” The main meaning is generally recoverable, but some grammatical errors and punctuation problems remain. For example, “the pie charts shows” has subject–verb disagreement, while “The total number ... were 74000” mismatches the singular subject and verb. The opening also has a sentence-boundary problem in “annual basis.whereas,” and the long sentence about the pre-refurbishment figures is difficult to control. Use complete, clearly punctuated sentences, check singular/plural agreement, and build comparisons with parallel structures, such as “Before refurbishment, 40% were dissatisfied; afterwards, the figure was 15%.”
See this exact question answered at other band scores. The same prompt compared across bands.
Browse more IELTS Writing model answers or get your own writing scored by the same AI examiner.