Band 5.5 IELTS Writing Task 1 Model Answer
Overall Band Score: 5.5 · Cambridge IELTS 11 · 2026-11-08
IELTS Writing Task 1 question
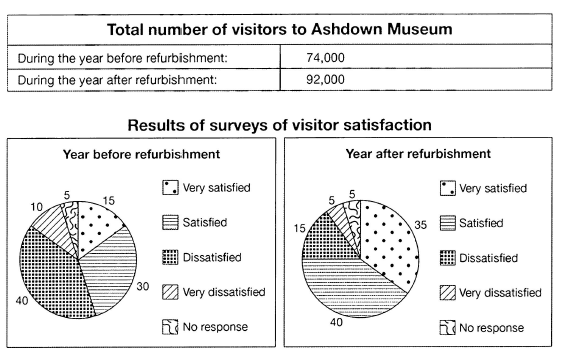
The table below shows the numbers of visitors to Ashdown Museum during the year before and the year after it was refurbished. The charts show the result of surveys asking visitors how satisfied they were with their visit, during the same two periods.
Summarise the information by selecting and reporting the main features, and make comparisons where relevant.
Student answer (Band 5.5)
The table illustrate the number of visitors to Ashdown museum during the year before and the year after it was refurbished. The chart illustrate the result of surveys asking visitors how satisfied they were with their visit during the same two periods.
As we see the result during the year before refurbishment there are 74000 visitors visit the Ashdown museum. There are 15% visitors are very satisfied before refurbishment from total number of visitors. The 30% visitors are satisfied from before refurbishment. 40% visitors are dissatisfied from it. 10% visitors are very dissatisfied from it. And only 5% visitors are no response.
As we see the result during the year after refurbishment there are 92000 visitors visit the Ashdown museum. There are 35% visitors are very satisfied year after refurbishment. 40% visitors are satisfied from it. 15% are dissatisfied from it. 5% visitors are very dissatisfied from it. And 5% visitors are no response on it.
In conclusion, there is huge change is recorded in the ratio of visitors that are very satisfied and only satisfied. After refurbishment the rate is increased from 15% to 35% and rate of only satisfied is increses from 30% to 40%.
AI examiner evaluation
| Criterion | Band |
|---|---|
| Task Achievement / Task Response | 5.5 |
| Coherence and Cohesion | 5.5 |
| Lexical Resource | 5.0 |
| Grammatical Range and Accuracy | 5.0 |
| Overall | 5.5 |
Task Achievement / Task Response: Band 5.5
You report the key figures accurately: visitor numbers rose from 74,000 to 92,000, and all five satisfaction categories are correctly stated for both years. The comparison that very satisfied responses increased from 15% to 35%, while satisfied responses rose from 30% to 40%, is also relevant. However, the response is mainly a list of figures rather than a clear summary of the main features. The overview is confined to the final sentence and omits the important overall shift: dissatisfaction fell substantially after refurbishment, while the no-response share stayed at 5%. Develop this broad comparison and select the most significant changes instead of describing each category in repetitive detail. The 35 words copied from the task prompt were not counted.
Coherence and Cohesion: Band 5.5
The response has a basic, understandable structure: it introduces the visuals, describes the two periods in separate paragraphs, and ends with a comparison. This helps the reader follow the before-and-after information. However, progression is limited because both data paragraphs repeat the same sequence of categories and begin with the mechanical phrase “As we see the result.” The repeated sentence pattern makes the report read like a list, and “In conclusion” introduces a comparison that would work better as a concise overview near the beginning. Group related changes—for example, the rise in positive ratings alongside the fall in dissatisfaction—and use clearer links between these trends. This would create a more purposeful flow without relying on repeated transitions.
Lexical Resource: Band 5.0
You use relevant task vocabulary, including “refurbishment,” “visitors,” “very satisfied,” and “dissatisfied,” so the main information is generally understandable. However, the range is limited and several phrases are repeated or imprecise, such as “As we see the result,” “visitors visit,” and “satisfied from it.” These choices make the report sound less natural and sometimes obscure the relationship between the figures and the survey categories. There is also a spelling error in “increses.” Aim for concise reporting language and accurate collocations, such as describing the proportion of visitors who were satisfied or noting that a figure rose or fell. More varied, precise wording would make the comparisons clearer.
Grammatical Range and Accuracy: Band 5.0
Most of the response uses short, simple statements, and the figures can usually be understood. However, grammatical errors occur frequently and affect clarity. For example, “The table illustrate” and “The chart illustrate” have subject–verb agreement errors, while “there are 74000 visitors visit” combines an incorrect construction with an unnecessary verb. Phrases such as “There are 15% visitors are very satisfied” also contain faulty sentence structure. The final sentence, “there is huge change is recorded,” shows a similar problem with verb forms and articles. Practise forming accurate comparison sentences, such as “The proportion of very satisfied visitors rose from 15% to 35%,” and check agreement, articles, and sentence boundaries. Greater control of these basic patterns is needed before attempting more complex structures.
See this exact question answered at other band scores. The same prompt compared across bands.
Browse more IELTS Writing model answers or get your own writing scored by the same AI examiner.