Band 6.0 IELTS Writing Task 1 Model Answer
Overall Band Score: 6.0 · Cambridge IELTS 11 · 2026-11-08
IELTS Writing Task 1 question
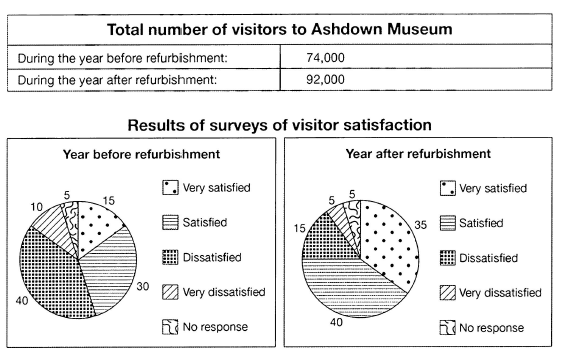
The table below shows the numbers of visitors to Ashdown Museum during the year before and the year after it was refurbished. The charts show the result of surveys asking visitors how satisfied they were with their visit, during the same two periods.
Summarise the information by selecting and reporting the main features, and make comparisons where relevant.
Student answer (Band 6.0)
The table shows the numbers of tourist who visited Ashdown Museum during and before the year it was refurbished. It also represents the results of survey of visitor satisfaction.
Overall, there was a significant increase in a number of visitors after the refurbishment of the Museum. Also, visitors were very satisfied after the renovation, as campare to the year before refurbishment.
Survey table showed diffirent results of satisfaction before and after repairing the Museum. Almost, 40% of the tourist were dissatisfied before the renovation but after the renovation satisfaction level reaches upto 40% and only 15% visitors were disssatisfied. However, 35% visitors were very satisfied but back in year before refurbishment only 15% visitors were very satisfied. The no response from visitors remained the same that was 5%. Furthermore, 10% of the visitors were very dissatisfied year before renovation but this decrease to 5% in the year before refurbishment.
All in all, total number of visitors during the year before renovation was 74000 but it increases after the renovation and reached upto 92000.
AI examiner evaluation
| Criterion | Band |
|---|---|
| Task Achievement / Task Response | 6.5 |
| Coherence and Cohesion | 6.0 |
| Lexical Resource | 5.5 |
| Grammatical Range and Accuracy | 5.5 |
| Overall | 6.0 |
Task Achievement / Task Response: Band 6.5
You cover both the visitor total and the satisfaction surveys, and the overview identifies the main changes: attendance rose from 74,000 to 92,000, while satisfaction improved. Most figures are accurately reported, including the rise in “very satisfied” responses from 15% to 35% and the fall in dissatisfaction from 40% to 15%. This meets the task well, with some features more fully reported than others. One comparison is unclear or inaccurate: “satisfaction level reaches upto 40%” appears to refer to the satisfied category, which was 40%, while very satisfied responses were 35%. Also, the final sentence says “year before refurbishment” for the fall in very dissatisfied responses; this should be the year after. A sharper overview distinguishing satisfied from very satisfied would strengthen the response further.
Coherence and Cohesion: Band 6.0
The response has a clear overall arrangement: an introduction, an overview, details of the survey results, and a final comparison of visitor totals. This makes the information easy to follow. You also use linking expressions such as “Overall,” “However,” and “Furthermore” to signal relationships between points. However, some connections are mechanical or unclear. “Survey table showed different results” does not clearly introduce the two survey periods, and “All in all” repeats the overview rather than adding a useful concluding comparison. The sentence about very dissatisfied visitors is especially confusing because it says the figure decreased “in the year before refurbishment.” Grouping the positive responses together, then the negative responses, and using precise references to each year would create smoother progression.
Lexical Resource: Band 5.5
You use relevant vocabulary for describing the charts, including “significant increase,” “dissatisfied,” “very satisfied,” and “remained the same.” These choices communicate the main trends, but the range and control are limited by repeated use of “renovation,” “refurbishment,” and “visitors,” as well as several inaccurate or misspelled forms. Examples include “tourist” where the plural is needed, “campare,” “diffirent,” “disatisfied,” and “upto.” Some phrasing is also unnatural, such as “satisfaction level reaches upto 40%” and “back in year before refurbishment.” Aim for precise chart language and check spelling and collocations; for example, describe a percentage as “accounted for” or “stood at” a value. This would make the report more fluent and exact.
Grammatical Range and Accuracy: Band 5.5
You attempt a mix of sentence forms, including contrastive clauses with “but” and “however,” and most of the intended meaning remains understandable. There are nevertheless some recurring grammatical errors. In the opening, “numbers of tourist” needs a plural noun, and “results of survey” needs an article or plural form. The sentence “satisfaction level reaches” shifts tense in a report about completed periods; use the past tense, and make the subject and comparison explicit. In “this decrease to 5%,” the verb form should be “decreased,” while “that was 5%” would be more naturally integrated as “at 5%.” The final sentence also has an unclear time reference. More consistent past-tense reporting and careful checking of articles, plurals, and verb forms would improve accuracy.
See this exact question answered at other band scores. The same prompt compared across bands.
Browse more IELTS Writing model answers or get your own writing scored by the same AI examiner.