Band 5.0 IELTS Writing Task 1 Model Answer
Overall Band Score: 5.0 · Cambridge IELTS 11 · 2026-11-08
IELTS Writing Task 1 question
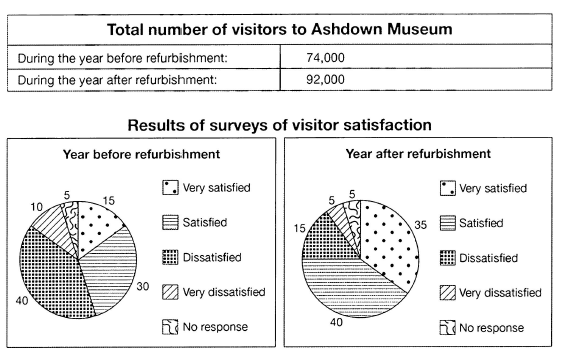
The table below shows the numbers of visitors to Ashdown Museum during the year before and the year after it was refurbished. The charts show the result of surveys asking visitors how satisfied they were with their visit, during the same two periods.
Summarise the information by selecting and reporting the main features, and make comparisons where relevant.
Student answer (Band 5.0)
The table displayed the figure of visitors who visited the Ashdown Museum before and after the year it was reconstructed. The pie chart illustrates the outcome of surveys about the visitor how satisfied they were during the both period.
Overall, Ashdown Museum had the highest number of visitors after the refurbishment. The dissatisfaction rate was higher before and decreased after the reconstruction.
The dissatisfaction rate was just under a half by the number of visitors before and the second highest was satisfication rate showed by the people who visited, which was about just below a third and remaining contributed the least in term of satisfication 10,5 and 15 respectively.
After the refurbishment, satisfaction outcomes just under a half before was below a third. The tourists become more satisfied just above the third.
AI examiner evaluation
| Criterion | Band |
|---|---|
| Task Achievement / Task Response | 5.0 |
| Coherence and Cohesion | 5.5 |
| Lexical Resource | 5.0 |
| Grammatical Range and Accuracy | 5.0 |
| Overall | 5.0 |
Task Achievement / Task Response: Band 5.0
You identify the main overall changes: visitor numbers rose after refurbishment, and dissatisfaction fell. However, the account of the survey results is incomplete and some comparisons are unclear or inaccurate. Before refurbishment, dissatisfaction (40%) was the largest group, while satisfaction was 30%; after refurbishment, satisfaction totalled 75% (35% very satisfied and 40% satisfied), and dissatisfaction fell to 20%. Your phrase “just above the third” appears to refer to the 35% who were very satisfied, but the categories are not clearly distinguished. The response also omits the visitor totals of 74,000 and 92,000. The required minimum length is not met, which contributes to the limited development. Include the key figures and explain the main shifts more precisely.
Coherence and Cohesion: Band 5.5
The response has a basic structure, with an introduction, an overview and separate discussion of the two periods. This gives the reader some sense of organisation, and “Overall” appropriately signals the summary. However, progression is weakened by unclear references and abrupt comparisons. For example, “the second highest was satisfication rate” does not clearly identify which survey category is being discussed, while “After the refurbishment, satisfaction outcomes just under a half before was below a third” is difficult to follow. The final sentence introduces “just above the third” without naming the category. Use one paragraph for the overview and one for each period, and connect each percentage directly to its category so the comparisons are easy to track.
Lexical Resource: Band 5.0
You use some relevant task vocabulary, including “visitors,” “surveys,” “dissatisfaction,” and “refurbishment,” so the topic is generally recognisable. However, the range is limited and several word choices or collocations are inaccurate or awkward, sometimes making the data difficult to interpret. “The table displayed the figure” would be more naturally expressed as “the table shows the number,” and “the visitor how satisfied they were” should be “how satisfied visitors were.” “Reconstructed” is not an appropriate substitute for “refurbished” in this context, and “satisfication” is misspelled. Aim for precise category labels such as “satisfied,” “dissatisfied,” and “very dissatisfied,” and avoid repeating broad terms when a specific survey group is available.
Grammatical Range and Accuracy: Band 5.0
You attempt both simple and more extended sentence forms, including “The table displayed the figure of visitors who visited…” and the overview beginning “Overall.” However, grammatical control is inconsistent, and errors in sentence construction often make comparisons hard to understand. In the introduction, “the visitor how satisfied they were” lacks a grammatical link; write “how satisfied visitors were.” “During the both period” has an incorrect determiner and number, while “the second highest was satisfication rate showed by the people” has a faulty clause structure. The final comparison, “satisfaction outcomes just under a half before was below a third,” also lacks a clear subject and verb relationship. Use shorter, complete sentences, check articles and plurals, and make sure each comparison has an explicit subject and verb.
See this exact question answered at other band scores. The same prompt compared across bands.
Browse more IELTS Writing model answers or get your own writing scored by the same AI examiner.