Band 4.5 IELTS Writing Task 1 Model Answer
Overall Band Score: 4.5 · Cambridge IELTS 11 · 2026-11-09
IELTS Writing Task 1 question
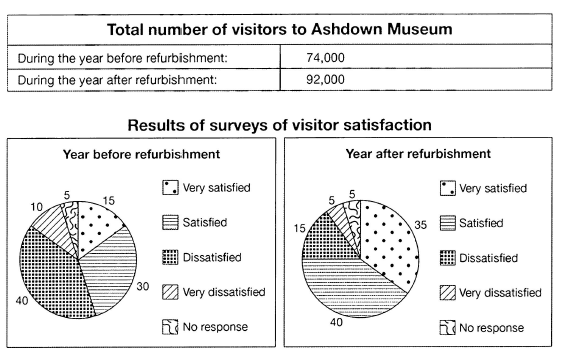
The table below shows the numbers of visitors to Ashdown Museum during the year before and the year after it was refurbished. The charts show the result of surveys asking visitors how satisfied they were with their visit, during the same two periods.
Summarise the information by selecting and reporting the main features, and make comparisons where relevant.
Student answer (Band 4.5)
These pie charts are comparisons between the survay visitors of museum .This chart shows the reporting and the main feature of the visitor. However in the first pie chart there are 15% people who are very setisfied Mean while in the second pie chart the frequency is increased.Which is 35 %. Any how in the first pie chart the percentage of the dis satified people is 40 % While in the next or second chart the percentage increased. As compared to the years the percentage fluctuated.
Moreover the part of the graph of that people who had same percentag which is 5 % in both pie chart of very dissatified people . The percentage remained same. Any how the laast part of these pie chart is satisfied of the people who decreased at second graph in first that is 10 % but in the second it seems low which is 5 %.
AI examiner evaluation
| Criterion | Band |
|---|---|
| Task Achievement / Task Response | 3.5 |
| Coherence and Cohesion | 4.5 |
| Lexical Resource | 4.5 |
| Grammatical Range and Accuracy | 5.0 |
| Overall | 4.5 |
Task Achievement / Task Response: Band 3.5
You identify some relevant survey figures, including very satisfied visitors rising from 15% to 35% and the unchanged 5% who gave no response. However, the response does not accurately cover the main features: dissatisfaction fell from 40% to 15%, but you say it increased, and you confuse the satisfied and very dissatisfied categories when describing the final figures. The total visitor numbers, 74,000 and 92,000, are not mentioned. There is also no clear overview of the overall improvement in satisfaction and visitor numbers. To strengthen the report, select the major trends, compare the two periods accurately, and avoid unsupported or contradictory statements such as “the percentage fluctuated.”
Coherence and Cohesion: Band 4.5
There is a basic attempt to organise the response by moving from one survey category to another, and linking expressions such as “Moreover” and “Meanwhile” show an effort to connect ideas. However, the progression is difficult to follow because the categories and comparisons are not consistently identified. For example, “the last part” does not make clear which response category is being discussed, and “in the next or second chart” is repeated without adding clarity. The response is presented as one block, with no distinct overview or clear grouping of the main comparisons. Use a short introduction, an overview, and focused paragraphs comparing related figures; make each reference to a chart or category explicit.
Lexical Resource: Band 4.5
You use some task-related vocabulary, including “pie chart,” “percentage,” “visitors,” and “satisfied,” so the topic is generally recognisable. However, the range is limited and several word choices or collocations make the meaning unclear, such as “the survay visitors,” “the reporting and the main feature,” and “the percentage fluctuated.” Spelling errors, including “survay,” “setisfied,” and “dissatified,” also reduce accuracy. Aim for precise reporting language and use the same labels as the chart, such as “very satisfied,” “satisfied,” and “dissatisfied.” Alternatives like “rose,” “fell,” and “remained unchanged” will help you describe the data more clearly.
Grammatical Range and Accuracy: Band 5.0
You attempt both simple statements and longer comparisons, and several basic clauses communicate a recognisable idea, for example, “The percentage remained same.” However, sentence boundaries and punctuation are often poorly controlled: “Which is 35 %” is an incomplete sentence, while several clauses run together without appropriate punctuation. Articles and sentence patterns are also inconsistent, as in “the percentage of the dissatisfied people” and “in first that is 10%.” These issues make some comparisons harder to interpret, although the reader can still understand parts of the response. Practise writing complete sentences with a clear subject and verb, then check articles, punctuation, and how comparison clauses are joined.
See this exact question answered at other band scores. The same prompt compared across bands.
Browse more IELTS Writing model answers or get your own writing scored by the same AI examiner.