Band 6.0 IELTS Writing Task 1 Model Answer
Overall Band Score: 6.0 · Cambridge IELTS 11 · 2026-11-10
IELTS Writing Task 1 question
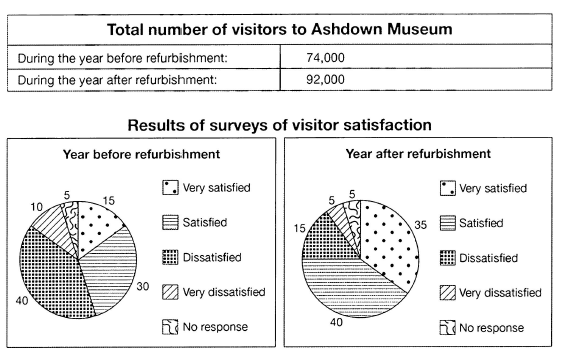
The table below shows the numbers of visitors to Ashdown Museum during the year before and the year after it was refurbished. The charts show the result of surveys asking visitors how satisfied they were with their visit, during the same two periods.
Summarise the information by selecting and reporting the main features, and make comparisons where relevant.
Student answer (Band 6.0)
Statistical report of number of visitors and their reviews to Ashdown museum is displayed on the table and chart. As shown on the table, the amount of visitors visiting the meuseum anually, before the refurbishment were pretty good, but after the the refurbishment the number of visitors were astonishing.
The visitor satisfactory chart describes that before the refubishment only 15% of the customers were very satisfied, but after the refubishment, this percentage increase drastically by 20%, which makes 35% of the visitors very satisfied. Moreover, after the refubishment, the percentage of satisfied visitors are 40%, making a 10% rise before refubishment.
However, a significant fall is oberved in the Disatisfied visitors after the refurbishment. Earlier, dissatisfied visitors were 40%, but after the refurbishment, the percentage drops to 15%.In addition to it, the very dissatisfied visirtors had also dropped by 5% making it a total of 5% only after the refubishment. No change was observed for the visitors giving no response, which remains to 5% before and after the refurbishment.
It can be concluded that after the refurbishment, the visitors were way more satisfied than before which is also reflected by the numbers of visitors visiting the museum anually which had increased by 18000 visitors anually.
AI examiner evaluation
| Criterion | Band |
|---|---|
| Task Achievement / Task Response | 7.0 |
| Coherence and Cohesion | 6.5 |
| Lexical Resource | 5.5 |
| Grammatical Range and Accuracy | 5.5 |
| Overall | 6.0 |
Task Achievement / Task Response: Band 7.0
You cover the main features and make accurate comparisons: visitor numbers rose from 74,000 to 92,000, satisfaction increased, and dissatisfaction declined. The figures for each survey category are reported correctly, including the unchanged 5% with no response. Your concluding comparison gives a clear overall message, and the response is supported with relevant data. To make the overview more effective, state the two dominant trends directly near the beginning rather than relying mainly on evaluative phrases such as “pretty good” and “astonishing.” Also, “increased by 20%” is less precise than “rose by 20 percentage points,” since the figures are proportions. Overall, the key information is addressed and supported, though the overview could be more concise and precise.
Coherence and Cohesion: Band 6.5
The response has a clear overall sequence: it introduces the visuals, compares the positive satisfaction categories, turns to dissatisfaction, and ends with a summary. Paragraphing helps separate these stages, and linking expressions such as “Moreover,” “However,” and “In addition to it” make relationships between points visible. This gives the report a coherent arrangement. However, some connections feel mechanical, and the opening mixes visitor totals with a general judgement before clearly presenting the main trends. The final sentence repeats the conclusion already conveyed by the preceding comparisons. For stronger progression, give a concise overview after the introduction, then group related figures together and use fewer, more natural transitions.
Lexical Resource: Band 5.5
You use some relevant task vocabulary, including “percentage,” “dissatisfied,” “refurbishment,” and “significant fall,” so the reader can follow the comparisons. However, the range and control are uneven, with several noticeable spelling and word-choice problems: “meuseum,” “refubishment,” “ober ved” (written as “oberved”), and “visirtors.” Some expressions are also informal or imprecise for an academic report, such as “pretty good,” “astonishing,” and “way more satisfied.” “Visitor satisfactory chart” is an awkward collocation, while “the amount of visitors” is less suitable than a countable-noun expression. Choose neutral reporting language and check spelling and collocations carefully; this would make the account clearer and more appropriately formal.
Grammatical Range and Accuracy: Band 5.5
You attempt a mix of sentence forms, including contrast clauses and longer sentences with “which” and “making,” and the main comparisons are generally understandable. However, grammatical control is inconsistent. In “the amount of visitors … were,” the subject and verb do not agree, and “the percentage of satisfied visitors are 40%” also has an agreement error. The opening sentence has an awkward structure, while “before the refurbishment were pretty good” does not form a clear grammatical comparison. There are also punctuation problems, such as the missing space after “15%.” Aim for simpler, well-controlled sentences first, checking agreement and sentence boundaries, then use complex structures where they remain accurate.
See this exact question answered at other band scores. The same prompt compared across bands.
Browse more IELTS Writing model answers or get your own writing scored by the same AI examiner.