Band 6.0 IELTS Writing Task 1 Model Answer
Overall Band Score: 6.0 · Cambridge IELTS 11 · 2026-11-10
IELTS Writing Task 1 question
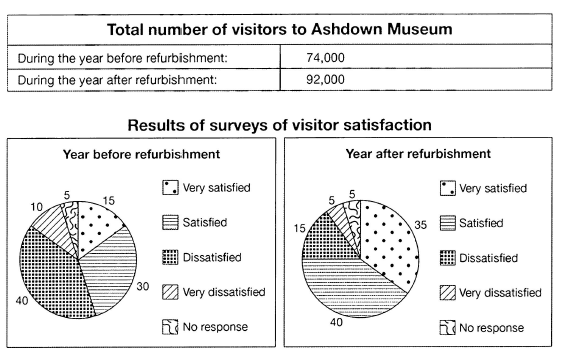
The table below shows the numbers of visitors to Ashdown Museum during the year before and the year after it was refurbished. The charts show the result of surveys asking visitors how satisfied they were with their visit, during the same two periods.
Summarise the information by selecting and reporting the main features, and make comparisons where relevant.
Student answer (Band 6.0)
The table chart presents the total number of visitors to Ashdown Museum before and after the year when it was restored. While, the pie chart illustrates that the outcomes of surveys asking guest during the same two periods, they were satisfied with their visit after remodeling.
Overall, in the table chart the total number of visitors increased during the year after restoration. Whereas, in the pie chart, the results of surveys after refurbishment were increased in very satisfied and satisfied visitors, but dissatisfied and very dissatisfied visitors were decreased. Some vistiors was giving no response similarly, before and after year.
In the table, total number of visitors to Ashdown Museum was 74,000 during the year before refurbishment, while it increased the visiotors around 92,000 after refurbisment. The outcomes of visitirs was changed with different views. The very satisfied visitors was 15% before remodeling and accounted it 35% after remodeling.
The satisfied visitors was also increased from 30% to 40%. The result of dissatisfied visitors declined from 40% to 15% before and after refurbisment. The results of very dissatisfied vistors was halved during the year. In addition, there was no change in results of surveys who given no response in before and after remodeling.
AI examiner evaluation
| Criterion | Band |
|---|---|
| Task Achievement / Task Response | 7.0 |
| Coherence and Cohesion | 6.0 |
| Lexical Resource | 5.5 |
| Grammatical Range and Accuracy | 5.0 |
| Overall | 6.0 |
Task Achievement / Task Response: Band 7.0
You cover the main features and make accurate comparisons: visitor numbers rose from 74,000 to 92,000, satisfaction increased in both positive categories, and dissatisfaction fell. The overview identifies these broad trends, while the body includes the key survey figures, including the unchanged 5% with no response. This gives the report a clear, relevant account of both the table and charts. To make the account more fully developed, state the most striking contrast explicitly: dissatisfaction was the largest group before refurbishment, whereas satisfaction became the largest category afterwards. Also clarify that very dissatisfied responses fell from 10% to 5%; “was halved” is correct but less precise than reporting both values.
Coherence and Cohesion: Band 6.0
The response has a recognisable structure: an introduction, an overview, and two paragraphs of supporting details. Its progression from visitor totals to survey results is generally easy to follow, and words such as “Overall,” “while,” and “In addition” help connect information. However, some linking is mechanical or awkward: “Whereas” begins a sentence fragment, and “While” in the introduction does not lead into a complete, well-formed contrast. The overview also repeats the same before-and-after pattern later without clearly prioritising the most important comparison. Use complete sentences and organise the survey details into a deliberate contrast between positive and negative responses; clearer referencing would also reduce repetition.
Lexical Resource: Band 5.5
You use relevant task vocabulary, including “refurbishment,” “increased,” “declined,” and “no response,” so the main information is understandable. However, the range and control are limited by repeated wording and inaccurate or unnatural choices. “Table chart” and “pie chart” are not reliable descriptions of the visuals, and “outcomes of surveys” is less natural than “survey results.” There are also noticeable spelling errors, such as “vistiors,” “visiotors,” “refurbisment,” and “vistors,” alongside inconsistent forms such as “guest” and “visitors.” Choose precise terms for the table and charts, vary “visitors” with care, and proofread spelling and collocations to make the report more fluent and exact.
Grammatical Range and Accuracy: Band 5.0
You attempt both simple and more complex sentence forms, including comparisons with “while” and “from … to …,” and the reader can usually understand the intended trends. However, control is uneven, particularly with sentence boundaries, agreement, and verb forms. “While, the pie chart illustrates …” is an incomplete construction, and “Whereas, in the pie chart …” is also a fragment. Agreement errors appear in “Some visitors was giving” and “The very satisfied visitors was 15%.” The phrase “it increased the visitors around 92,000” also lacks a clear grammatical structure. Build complete sentences around each comparison, check singular and plural subjects, and use accurate past-tense forms consistently.
See this exact question answered at other band scores. The same prompt compared across bands.
Browse more IELTS Writing model answers or get your own writing scored by the same AI examiner.