Band 5.5 IELTS Writing Task 1 Model Answer
Overall Band Score: 5.5 · Cambridge IELTS 11 · 2026-11-10
IELTS Writing Task 1 question
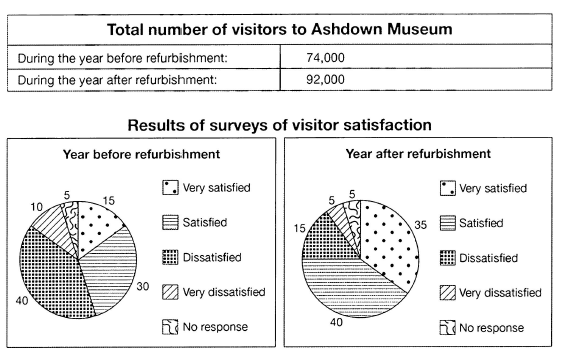
The table below shows the numbers of visitors to Ashdown Museum during the year before and the year after it was refurbished. The charts show the result of surveys asking visitors how satisfied they were with their visit, during the same two periods.
Summarise the information by selecting and reporting the main features, and make comparisons where relevant.
Student answer (Band 5.5)
The table below shows a number of visitors that visited Ashdown Museum dueing the year before it was refurbished and after it was refurbished.
The total numbers of vistor that visited the museum during the year before it was refurbished was 74,000 people. The chart shows 5% of did not response back after the first visiting and also says that 10% of visitors where very dissatified with the museum.15% of vistors were satisfied with the enviroment of the muesum.
30% of visitors that visited were vert satisfied with the ambience of the muesum and lastly 40% of visitors were dissatified with the museum
The total numbers of visitors thst visited the museum year after refurishment increased to 92,000. The chart shows that just 5% of people visited and there was no response and another 5% of people very dissatisfied with the enviroment.. 15% of people were dissatisfied with the enviroment. 35% of vistiors was very satisfied and 40% was equally very satisfied
Overall, 5% of vistors did nit get back to the museum both before and after the year of refurbishment and also before the year10 % of visistor got dissatisfied and it got reduced after the year of refurbishment to 5%.
15% of visors was very satisfied during the year if refurbishment and it increases after the year of refurbishment to 35%. 40% of vistors were dissatisfied before the refurbishment and it reduces to 15% after refurbishment. then lastly 30% of vistors were satisified and increases to 40% after the year of refurbishment.
AI examiner evaluation
| Criterion | Band |
|---|---|
| Task Achievement / Task Response | 6.0 |
| Coherence and Cohesion | 5.5 |
| Lexical Resource | 5.0 |
| Grammatical Range and Accuracy | 5.0 |
| Overall | 5.5 |
Task Achievement / Task Response: Band 6.0
You cover both the visitor total and the satisfaction results for the two periods, and the main changes are generally identifiable: attendance rose from 74,000 to 92,000, while dissatisfaction fell and satisfaction increased. However, several figures are mislabelled. Before refurbishment, 15% were very satisfied and 30% satisfied, but you reverse these in the first description; after refurbishment, 40% were satisfied, not “equally very satisfied.” The overview also focuses on individual figures rather than clearly summarising the overall pattern. State the key trends once in a concise overview, then compare the categories accurately. The claim that 5% “did not get back to the museum” is also unclear: this category means no response to the survey, not failure to return.
Coherence and Cohesion: Band 5.5
The response has a recognisable sequence: it describes the first period, then the second, and ends with comparisons. This gives the reader some overall organisation. However, the final paragraph repeats many figures already reported, and the repeated use of “and,” “also,” and “lastly” makes the progression mechanical rather than clearly comparative. Some links between ideas are difficult to follow, particularly where the response says “just 5% of people visited and there was no response.” Use separate paragraphs for an overview and the detailed comparisons, and group the satisfaction categories by direction of change—for example, rising satisfaction together and falling dissatisfaction together. This would reduce repetition and make relationships between the figures clearer.
Lexical Resource: Band 5.0
You use relevant task vocabulary such as “visitors,” “refurbishment,” “dissatisfied,” and “increased,” so the topic is usually understandable. However, the range is limited and several word-choice or spelling errors make parts unclear: “did not response back,” “ambience,” “enviroment,” and “did nit get back” do not accurately express the survey categories. “Visited” is also repeated where “respondents” or “visitors” would be more precise. Use the chart’s category labels consistently—“no response,” “very satisfied,” and “dissatisfied”—and choose verbs that describe data, such as “accounted for,” “rose,” and “fell.” Check spelling carefully, especially for repeated key terms, as these errors affect clarity.
Grammatical Range and Accuracy: Band 5.0
You attempt both simple statements and longer sentences, and the reader can usually identify the figures being discussed. However, grammatical control is uneven, with recurring problems in agreement, articles, and sentence construction. For example, “The total numbers … was 74,000” has a plural subject with a singular verb, while “35% of vistiors was very satisfied” has the same agreement problem. The opening phrase “a number of visitors that visited” is also awkwardly constructed, and several sentences join multiple points without clear punctuation. Aim for shorter, complete comparisons, such as “The number of visitors rose to 92,000 after refurbishment.” Check subject–verb agreement and use consistent sentence patterns when reporting percentages.
See this exact question answered at other band scores. The same prompt compared across bands.
Browse more IELTS Writing model answers or get your own writing scored by the same AI examiner.