Band 6.0 IELTS Writing Task 1 Model Answer
Overall Band Score: 6.0 · Cambridge IELTS 11 · 2026-11-11
IELTS Writing Task 1 question
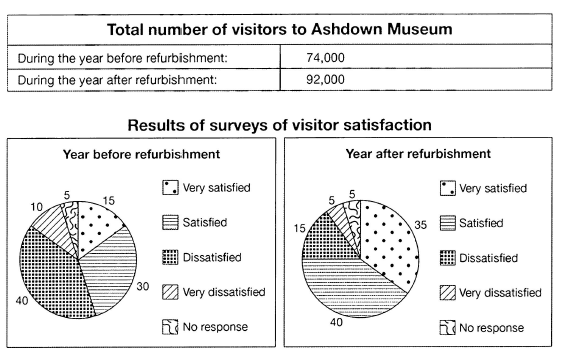
The table below shows the numbers of visitors to Ashdown Museum during the year before and the year after it was refurbished. The charts show the result of surveys asking visitors how satisfied they were with their visit, during the same two periods.
Summarise the information by selecting and reporting the main features, and make comparisons where relevant.
Student answer (Band 6.0)
The table and two pie cahrts illustrates the number of visitors to Ashdown Museum during the year before and after refurbishment and also about the satisfaction of visitors when they visit.
Firstly, the total number of visitors to Ashdown Museum during the year after refurbishment is 92,000, which marked the highest figure. While, the total number of visitors during the year before refurbishmnet is 74,000 and there is a huge gap between them about 18,000.
On the other hand, visitors who are dissatisfied before the refurbishment stood at 40%, which marked the highest figure, whereas visitors who are satisfied was 30%, followed by the visitors who are very satisfied was about 15%, while the visitors who are very dissatisfied was 10%.Lastly, the visitors that have no response stood at 5%, which marked the lowest figure.
Therefore, visitors who are satisfied year after the refurbishment now increased to 40% and also the number of very satisfied people was also increased to 35%. However, the number of visitors who are dissatisfied was now decreased to 15% and also the number of very dissatisfied people also decreased to 5%. Therefore, the number of no response was same in both year before and after about 5%.
AI examiner evaluation
| Criterion | Band |
|---|---|
| Task Achievement / Task Response | 6.5 |
| Coherence and Cohesion | 6.0 |
| Lexical Resource | 5.5 |
| Grammatical Range and Accuracy | 5.5 |
| Overall | 6.0 |
Task Achievement / Task Response: Band 6.5
You report the main visitor total accurately, noting the rise from 74,000 to 92,000, and cover all five satisfaction categories for both periods. Your comparisons also identify the key shift from dissatisfaction before refurbishment to greater satisfaction afterwards. This meets the task well, with the overview implicit in the contrast you describe. To make the response more fully developed, state that overall satisfaction (satisfied or very satisfied) became the dominant pattern after refurbishment, while dissatisfaction fell substantially; this would synthesise the chart rather than list changes category by category. Also, “marked the highest figure” is not quite accurate for the visitor total: it was the higher of the two totals, not a satisfaction category. The figures themselves are otherwise grounded in the visual.
Coherence and Cohesion: Band 6.0
The response has a clear overall sequence: an introduction, the visitor totals, the pre-refurbishment survey, and then the post-refurbishment results. This makes the information easy to follow. However, the organisation is somewhat mechanical, with “Firstly,” “On the other hand,” “Therefore,” and “Lastly” doing much of the linking. “On the other hand” does not express a clear contrast between the visitor total and the survey breakdown, and “Therefore” is repeated without a cause-and-effect relationship. The final paragraph would be clearer if it directly compared the two years in paired categories. Use fewer, more precise transitions and add a concise overview to strengthen progression and cohesion.
Lexical Resource: Band 5.5
You use relevant task vocabulary, including “refurbishment,” “dissatisfied,” “very satisfied,” and “stood at,” so the reader can understand the data being described. However, the range is limited and several phrases are repetitive or imprecise, such as “the number of visitors who are satisfied” and “marked the highest figure.” There are also spelling errors in “cahrts” and “refurbishmnet,” and “about” is an informal or vague choice when reporting exact figures. Aim for more concise data language and accurate collocations, while varying how you describe increases and decreases. These improvements would make the report more precise and natural.
Grammatical Range and Accuracy: Band 5.5
You attempt a mix of sentence forms, including comparisons with “whereas” and clauses introduced by “which,” and the main information remains understandable. Some errors in agreement and sentence construction are noticeable: “The table and two pie charts illustrates” should use a plural verb, while “visitors who are satisfied was 30%” has a subject–verb mismatch. The opening sentence also has an awkward structure, and “While” begins a fragment in “While, the total number…” rather than joining a complete contrast. Punctuation is inconsistent, including the missing space after “10%.” and the comma after “While.” Practise accurate agreement and combine comparisons into complete, controlled sentences.
See this exact question answered at other band scores. The same prompt compared across bands.
Browse more IELTS Writing model answers or get your own writing scored by the same AI examiner.