Band 5.5 IELTS Writing Task 1 Model Answer
Overall Band Score: 5.5 · Cambridge IELTS 11 · 2026-11-11
IELTS Writing Task 1 question
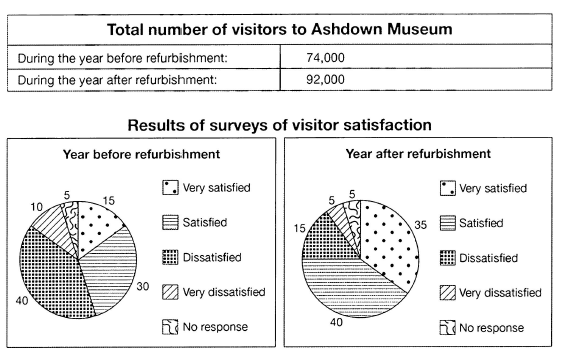
The table below shows the numbers of visitors to Ashdown Museum during the year before and the year after it was refurbished. The charts show the result of surveys asking visitors how satisfied they were with their visit, during the same two periods.
Summarise the information by selecting and reporting the main features, and make comparisons where relevant.
Student answer (Band 5.5)
The given pictorial graph illustrates about the number of visitors ot Ahdown museum during the year before and the year after it was refurbished.However the chart show the results of survey asking the visitors how they were satisfied in the same period of time.
overall, it was evident that the the before the refurbishment the result was negative but after it the holds the most the positive which also increased the number of visitors.
Firstly, the total number of visitors was only 74,000 before the museum was refurbished . In which the satisfied visitors was aroud 30%. However the viitors who were highly was over 15% . further the visiors who had very bad experience was 40% which also had the 10% of proportion who had very bad response. but there wer also sone people who didn't give any response were 5%.
subsequentely, the total number of visitors got boost after they refurbished the museum, which holds amount of vistors of 92,000 .In which the 35% were highly satisfied and some people also had perfectely satisfied over 40%. In addition the other also had responce like not liked that , very bad responce and no responce which had the percentag of 15%, 5%, 5% respectively
AI examiner evaluation
| Criterion | Band |
|---|---|
| Task Achievement / Task Response | 6.0 |
| Coherence and Cohesion | 5.5 |
| Lexical Resource | 5.0 |
| Grammatical Range and Accuracy | 5.0 |
| Overall | 5.5 |
Task Achievement / Task Response: Band 6.0
You cover both the visitor totals and the satisfaction surveys, and the figures you report are generally accurate: visitors rose from 74,000 to 92,000, while satisfaction increased after refurbishment. Your overview identifies this broad improvement, which is an important feature. However, some details are unclear or mislabelled. Before refurbishment, 40% were dissatisfied and 10% very dissatisfied; describing these as a “very bad experience” and a “very bad response” does not distinguish the categories clearly. Likewise, “perfectely satisfied over 40%” obscures that 40% were satisfied, not very satisfied. Make the overview more precise by stating that dissatisfaction fell substantially while satisfaction rose, and report each category using the chart’s labels.
Coherence and Cohesion: Band 5.5
The response has a recognisable structure: an introduction, an overview, and two paragraphs comparing the periods. “Firstly” and “subsequentely” also signal the shift from the earlier year to the later one. However, progression within paragraphs is sometimes difficult to follow because several figures and categories are packed into long, loosely connected sentences. The overview’s wording—“the before the refurbishment the result was negative but after it the holds the most the positive”—makes the main comparison hard to understand. Use clearer topic sentences and group the figures consistently, for example, report the two positive categories together and then the two negative categories. More precise links between ideas would make the organisation feel less mechanical and improve clarity.
Lexical Resource: Band 5.0
You attempt a range of vocabulary, including “refurbished,” “proportion,” “subsequently” and “in addition,” and the reader can usually identify the topic. However, inaccurate word choice, spelling and collocation often make the descriptions unclear. Phrases such as “highly was over 15%,” “perfectely satisfied,” and “had response like not liked that” do not express the survey categories naturally. There are also repeated spelling errors, including “viitors,” “vistors” and “responce.” Use the chart’s exact labels—“very satisfied,” “satisfied,” “dissatisfied” and “very dissatisfied”—rather than informal paraphrases. This would make the vocabulary more precise and reduce the effort required to interpret your comparisons.
Grammatical Range and Accuracy: Band 5.0
You attempt both simple and more extended sentence forms, including clauses introduced by “which” and “however.” Nevertheless, sentence boundaries and grammatical control are inconsistent, and some errors make relationships between ideas difficult to follow. For example, “However the chart show the results of survey” has subject–verb and article errors, while “In which the satisfied visitors was aroud 30%” is an incomplete sentence with faulty agreement. The overview also contains a sentence fragment or unclear construction. Practise writing complete sentences with a clear subject and verb, and check agreement, articles and punctuation. A few well-controlled comparisons using structures such as “while” or “whereas” would show range more effectively.
See this exact question answered at other band scores. The same prompt compared across bands.
Browse more IELTS Writing model answers or get your own writing scored by the same AI examiner.