Band 5.5 IELTS Writing Task 1 Model Answer
Overall Band Score: 5.5 · Cambridge IELTS 11 · 2026-11-11
IELTS Writing Task 1 question
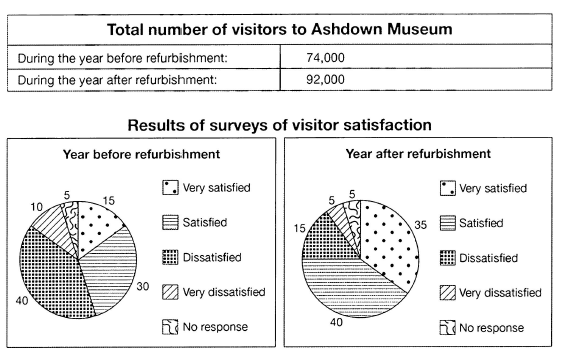
The table below shows the numbers of visitors to Ashdown Museum during the year before and the year after it was refurbished. The charts show the result of surveys asking visitors how satisfied they were with their visit, during the same two periods.
Summarise the information by selecting and reporting the main features, and make comparisons where relevant.
Student answer (Band 5.5)
Here we are talking about the survey of visitors, visited Ashdown museum during the year of refurbishment. before and after it takes place. There are 74,000 visitors came before refurbishment and 92,000 visitors after refurbishment.
The chart shows the exact percentage of the visitors who are very satisfied, satisfied, dissatisfied, very dissatisfied and no response visitors, These percentages are drawn in the diagram in the circle and marked by different types of lines in the circle, like very satisfied are marked with are small circles in the large one which are 15 %, satisfied are presented with 30% horizontal lines in the circle, Dissatisfied are 40 % with the small square boxes in the large circle, 10% are with very dissatisfied reaction with diagonal lines, and no response survey visitors are 5% with random line in the circle.
This illustration also shows the after part of refurbishment survey, with some different levels of opinions like 35% very satisfied, 40% are satisfied, level of dissatisfaction reduces to the 15%, and very dissatisfied and no response visitors are up to 5% only.
AI examiner evaluation
| Criterion | Band |
|---|---|
| Task Achievement / Task Response | 5.5 |
| Coherence and Cohesion | 5.5 |
| Lexical Resource | 5.5 |
| Grammatical Range and Accuracy | 5.0 |
| Overall | 5.5 |
Task Achievement / Task Response: Band 5.5
You report the visitor totals accurately and identify the main shift in satisfaction: the after-refurbishment figures show more positive responses and fewer dissatisfied visitors. However, the response does not provide a clear overview that brings these changes together, and much of the first chart description focuses on how the segments are drawn rather than what the figures mean. For example, the account of the pre-refurbishment results lists all five categories, but the comparison with the later survey is less complete: it does not explicitly state that satisfaction rose from 45% to 75%, or that dissatisfaction fell from 50% to 20%. A concise overview followed by selected, directly compared figures would make the key features clearer and more fully address the task.
Coherence and Cohesion: Band 5.5
The response has a basic sequence: it introduces the visitor totals, describes the earlier survey, and then turns to the later results. This gives the reader some sense of organisation. However, progression is limited because the first survey is described at length while the after-refurbishment figures are compressed into one paragraph, and there is no separate overview to guide the comparison. Linking is also sometimes awkward or repetitive, as in “This illustration also shows the after part of refurbishment survey.” Use clear paragraphs for the introduction, overview, and comparisons, and connect related figures directly—for example, contrast the rise in satisfied responses with the fall in dissatisfied responses. This would make the organisation more purposeful and reduce the list-like effect.
Lexical Resource: Band 5.5
You use relevant task vocabulary, including “visitors,” “refurbishment,” “percentage,” and the satisfaction categories, so the topic is generally understandable. However, the range is limited and several expressions are inaccurate or unnatural, which sometimes makes the description harder to follow. Examples include “the after part of refurbishment survey,” “no response survey visitors,” and “level of dissatisfaction reduces to the 15%.” The repeated use of “circle” and “marked” also spends vocabulary on visual styling rather than reporting data. Aim for precise chart language such as “the proportion of visitors who were satisfied” and “dissatisfaction fell to 20% overall.” More accurate collocations and less repetition would make the account clearer and more appropriate for an academic report.
Grammatical Range and Accuracy: Band 5.0
The response attempts both simple and longer sentence forms, but control is inconsistent, and errors in sentence construction, agreement, articles, and punctuation sometimes make the meaning difficult to follow. For instance, “There are 74,000 visitors came before refurbishment” combines incompatible verb forms; “very satisfied are marked with are small circles” has faulty structure and agreement; and “before and after it takes place” is an unclear fragment. Several long sentences also run together, with inconsistent capitalisation and comma use. Practise building accurate comparisons with a clear subject and verb, such as “The number of visitors rose from 74,000 to 92,000.” Shorter, well-punctuated sentences would help establish accuracy before you attempt more complex structures.
See this exact question answered at other band scores. The same prompt compared across bands.
Browse more IELTS Writing model answers or get your own writing scored by the same AI examiner.