Band 5.5 IELTS Writing Task 1 Model Answer
Overall Band Score: 5.5 · Cambridge IELTS 11 · 2026-11-11
IELTS Writing Task 1 question
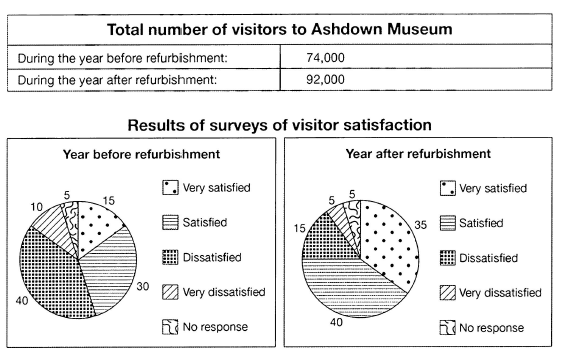
The table below shows the numbers of visitors to Ashdown Museum during the year before and the year after it was refurbished. The charts show the result of surveys asking visitors how satisfied they were with their visit, during the same two periods.
Summarise the information by selecting and reporting the main features, and make comparisons where relevant.
Student answer (Band 5.5)
This chart illustrate that people who visit the the Ashdown Museum is more after the refurbishment of the Museum.
Firstly we can talk about before refurbishment of the visitors. About 15% peoples are very satisfied from the Museum. There are more peoples who dissatisfied form the Museum. The percentage about 40%. 5% peoples who have no response about the Museum.
Secondly we can talk about after refuebishment about the Museum.Percentage of the visitors who are very satisfied is goes up from 15% to 35%. This will increase in very satisfied visitors. People who are just satisfy after the refurbishment of the Museum is more than before thr refurbishment of the visitors.The ratio between non response peoples is same.
In conclusion we can clearly see the difference between visitors who visit before and after the Ashdown Museum. The people who visit the Museum before refurbishment was 74000 and now after the refurbishment people visit the Museum is around 92000.
AI examiner evaluation
| Criterion | Band |
|---|---|
| Task Achievement / Task Response | 6.0 |
| Coherence and Cohesion | 6.0 |
| Lexical Resource | 5.0 |
| Grammatical Range and Accuracy | 5.0 |
| Overall | 5.5 |
Task Achievement / Task Response: Band 6.0
You cover both the visitor totals and the satisfaction surveys, and the figures you report—74,000 rising to 92,000, very satisfied increasing from 15% to 35%, dissatisfaction at 40% before refurbishment, and no response remaining at 5%—match the data. The response also identifies the broad improvement in satisfaction after the work. However, the overview is not stated clearly at the start, and several important comparisons are missing or only vaguely expressed: for example, satisfaction rose from 30% to 40%, while dissatisfaction fell from 40% to 15% and very dissatisfied responses from 10% to 5%. The claim that more visitors were satisfied is present but not supported with precise figures. A concise overview and fuller comparison of the main changes would make the report more complete.
Coherence and Cohesion: Band 6.0
The response has a recognisable structure: it moves from the period before refurbishment to the period after it, then ends with a conclusion. Sequencing phrases such as “Firstly,” “Secondly,” and “In conclusion” help the reader follow this basic progression. However, these links are somewhat mechanical, and the paragraphing does not clearly separate an overall summary from detailed comparisons. Some references are also unclear, as in “This will increase in very satisfied visitors” and “The ratio between non response peoples is same.” Grouping related figures together—for example, visitor totals in one comparison and satisfaction categories in another—and using clearer links such as “By contrast” or “Meanwhile” would improve the flow and make relationships between the data easier to understand.
Lexical Resource: Band 5.0
You use relevant vocabulary for describing the topic, including “refurbishment,” “percentage,” “visitors,” and “satisfied,” so the reader can generally identify the subject of each point. However, the range is limited and several phrases are inaccurate or repetitive, which sometimes makes the meaning less clear. Examples include “people who visit the Museum is more,” “dissatisfied form the Museum,” and “just satisfy.” There are also spelling errors such as “refuebishment” and “thr,” alongside repeated use of “people” and “Museum.” Choose precise chart language such as “the proportion of visitors” and “respondents,” and check spelling and collocations. This would make the report more natural and accurate without requiring unnecessarily advanced vocabulary.
Grammatical Range and Accuracy: Band 5.0
You attempt both short statements and longer comparisons, including “Percentage of the visitors who are very satisfied is goes up from 15% to 35%.” The intended trend is understandable, but some sentence structures and verb forms are inaccurate. For example, “This chart illustrate” has a subject–verb agreement error, while “is goes up” combines incompatible verb forms. Articles, plurals, and sentence boundaries also need attention, as in “the the Ashdown Museum,” “15% peoples,” and “Museum.Percentage.” These errors sometimes make the reader pause, although the main message can usually be recovered. Practise building clear comparison sentences with a consistent tense, such as “The proportion of very satisfied visitors rose from 15% to 35%,” and proofread for agreement, articles, and punctuation.
See this exact question answered at other band scores. The same prompt compared across bands.
Browse more IELTS Writing model answers or get your own writing scored by the same AI examiner.