Band 5.0 IELTS Writing Task 1 Model Answer
Overall Band Score: 5.0 · Cambridge IELTS 11 · 2026-11-11
IELTS Writing Task 1 question
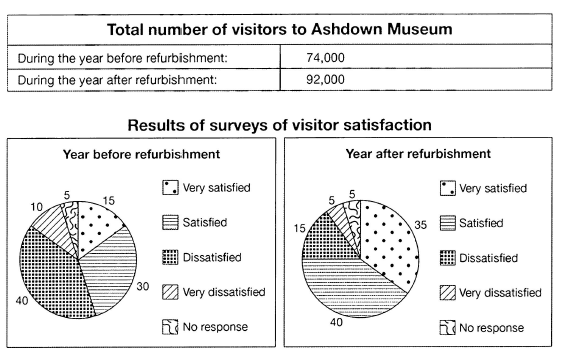
The table below shows the numbers of visitors to Ashdown Museum during the year before and the year after it was refurbished. The charts show the result of surveys asking visitors how satisfied they were with their visit, during the same two periods.
Summarise the information by selecting and reporting the main features, and make comparisons where relevant.
Student answer (Band 5.0)
The table below illustrate the number of visitors to Ashdown Museum during the year before and the year after it was reconstructed. The pie charts compare the result of surveys asking visitors how satisfied they were with their visit, during the same two periods.
Overall, after the Ashdown Museum was refurbished, it gained a lot of visitors, In addition visitors show high levels of satisfaction after that, and the levels of Dissatisfaction decreased.
Before it was rebunished, it had 74,000 visitors, but after that, the number increased until it reached 92,000 visitors the year after.
Year before the update, only 15% were very satisfied, Although 40% were unpleasant and 30% were satisfied. By contrast, after the major changes, 35% were very satisfied, and 40% were satisfied, while only 15% are not, and the proportion of individuals that were very dissatisfied declined from 10% to 5%.
AI examiner evaluation
| Criterion | Band |
|---|---|
| Task Achievement / Task Response | 5.0 |
| Coherence and Cohesion | 5.5 |
| Lexical Resource | 5.0 |
| Grammatical Range and Accuracy | 5.0 |
| Overall | 5.0 |
Task Achievement / Task Response: Band 5.0
You identify the main overall changes: visitor numbers rose from 74,000 to 92,000, satisfaction increased, and dissatisfaction fell. Several survey figures are also reported accurately, including the rise in “very satisfied” responses from 15% to 35% and the fall in “very dissatisfied” responses from 10% to 5%. However, the response is under-developed and does not cover the data fully: it omits the unchanged 5% who gave no response, and “only 15% are not” is unclear about which category this represents. The description of the earlier 40% as “unpleasant” also misrepresents the dissatisfied category. The response contains 112 words, below the 150-word minimum; this limits how fully you can select and explain the key features. Add a clearer overview and report the categories precisely.
Coherence and Cohesion: Band 5.5
The response has a recognisable structure, moving from an introduction and overview to visitor totals and then survey results. “By contrast” helps signal the comparison between the two periods. However, the progression is limited: the survey information is compressed into one paragraph, and the final comparison is difficult to follow because “only 15% are not” does not clearly identify the group. Some linking is also awkward or incorrectly punctuated, such as “In addition” following a comma and capital letter in the overview. Organise the survey figures into a clearer before-and-after comparison, and use linking phrases only where they clarify the relationship between data. This would make the sequence more coherent and reduce the effort required to interpret it.
Lexical Resource: Band 5.0
You use some relevant vocabulary for describing the charts, including “increased,” “declined,” “proportion,” and “satisfied.” However, the range is limited, and several choices are inaccurate or unnatural for a formal data summary. “Reconstructed” and “update” are less precise than “refurbished,” while “unpleasant” describes an experience rather than the survey category “dissatisfied.” “It gained a lot of visitors” is also informal and imprecise. There are spelling errors in “rebunished,” and repeated use of basic terms such as “after” and “number” limits flexibility. Aim for precise chart language and check spelling; for example, use “the number of visitors rose” and “the proportion who were dissatisfied fell.”
Grammatical Range and Accuracy: Band 5.0
You attempt both simple and more complex sentence forms, including a contrast with “but” and a comparison introduced by “Although.” However, errors are frequent enough to make some sentences awkward or unclear. The opening has subject–verb disagreement: “The table below illustrate” should be “illustrates.” In “the number increased until it reached 92,000 visitors,” the phrasing is grammatically possible but the construction is awkward for reporting a final figure; “rose to 92,000” is clearer. The sentence beginning “Year before the update” lacks an article, and “Although 40% were unpleasant and 30% were satisfied” is an incomplete clause after the comma. There are also inconsistent capitals and punctuation in the overview. Practise accurate sentence boundaries, articles, agreement, and consistent tense.
See this exact question answered at other band scores. The same prompt compared across bands.
Browse more IELTS Writing model answers or get your own writing scored by the same AI examiner.