Band 5.5 IELTS Writing Task 1 Model Answer
Overall Band Score: 5.5 · Cambridge IELTS 11 · 2026-11-11
IELTS Writing Task 1 question
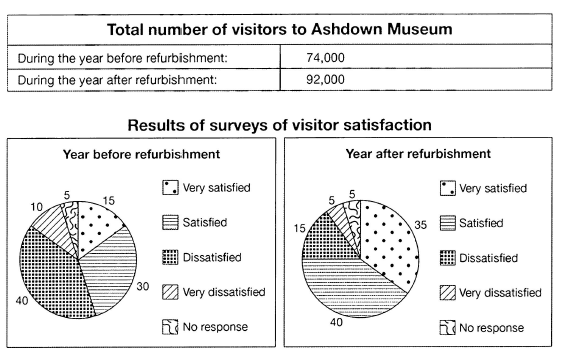
The table below shows the numbers of visitors to Ashdown Museum during the year before and the year after it was refurbished. The charts show the result of surveys asking visitors how satisfied they were with their visit, during the same two periods.
Summarise the information by selecting and reporting the main features, and make comparisons where relevant.
Student answer (Band 5.5)
The number of visitors a year before the refurbishment has been categorized to five different categories depending on their satisfiction level from the Ashdown Museum during their visit. The total number of visitors were 74,000 and about 40% was dissatisfied with their visit, which is the maximum number of visitors from the total. Following by those who were satisfied and they were about 30% of the total number of visitors. Those who were very satisfied was only 15% of the total visitors and 10 % of all were very dissatisfied, and some of them never expressed there feelings about their visit which was hardly 5% of the total visitors.
Now coming to the year after refurbishment those numbers are almost opposite to the past year. during this year the total visitors were 92,000 and 35% of them were very satisfied unlike last year which was only 15%. The number of dissatisfied also signaficantly changed after the refurbishment, before it were 40% and this time it was only 15%. Those number of visitors who were very dissatisfied were half this year. and almost the same number of people as last year never expressed their feelings.
AI examiner evaluation
| Criterion | Band |
|---|---|
| Task Achievement / Task Response | 5.5 |
| Coherence and Cohesion | 5.5 |
| Lexical Resource | 5.5 |
| Grammatical Range and Accuracy | 5.5 |
| Overall | 5.5 |
Task Achievement / Task Response: Band 5.5
You report several key figures accurately: visitors rose from 74,000 to 92,000, dissatisfaction fell from 40% to 15%, and the no-response share stayed at 5%. You also note the rise in very satisfied visitors from 15% to 35%. However, the response does not give a clear, concise overview of the main changes across both periods; instead, it moves through categories one by one. The claim that the figures were “almost opposite” is broad and does not capture the full pattern, especially the increase in the satisfied group from 30% to 40%. Include this comparison and summarise the overall shift from predominantly dissatisfied responses to predominantly satisfied ones. The figures are mostly relevant, but some important features are under-reported.
Coherence and Cohesion: Band 5.5
The response has a basic two-part structure, moving from the year before refurbishment to the year after, and phrases such as “Now coming to the year after refurbishment” signal the change in period. However, the progression is largely a list of individual categories rather than a comparison organised around the main trends. Some linking is awkward or repetitive, including “Following by those who were satisfied” and repeated references to “the total visitors.” The opening sentence is also difficult to follow, so the reader has to work to identify the subject and purpose. Group the figures into clear comparisons—for example, rising satisfaction and falling dissatisfaction—and use a concise overview before the details. This would make the organisation more coherent and the connections less mechanical.
Lexical Resource: Band 5.5
You use relevant vocabulary for describing the survey, including “dissatisfied,” “very satisfied,” “total number,” and “significantly changed.” This gives you enough language to communicate the main comparisons. However, several word choices and collocations are inaccurate or unnatural, such as “categorized to five different categories,” “Following by,” and “never expressed there feelings.” Spelling errors in “satisfiction” and “signaficantly” also reduce accuracy. Try to use standard chart-description phrases such as “the proportion of visitors who were satisfied” and “the figure for dissatisfaction fell.” Avoid repeating “number of visitors” when describing percentages, since the figures represent shares of survey responses. More precise and natural phrasing would make the comparisons easier to understand.
Grammatical Range and Accuracy: Band 5.5
You attempt both simple and more extended sentences, and the reader can generally understand the comparisons. However, errors in sentence structure and agreement occur throughout. For example, “The total number of visitors were 74,000” should use a singular verb, while “40% was dissatisfied” needs a clearer grammatical subject, such as “40% of respondents were dissatisfied.” The opening sentence is also difficult to parse, and “Those number of visitors … were very dissatisfied were half this year” contains a faulty structure. There are problems with articles, tense consistency, and sentence boundaries as well. Practise building accurate comparison sentences with a clear subject and verb, then check agreement and punctuation. Greater control of these patterns would make your range more effective.
See this exact question answered at other band scores. The same prompt compared across bands.
Browse more IELTS Writing model answers or get your own writing scored by the same AI examiner.