Band 6.0 IELTS Writing Task 1 Model Answer
Overall Band Score: 6.0 · Cambridge IELTS 11 · 2026-11-11
IELTS Writing Task 1 question
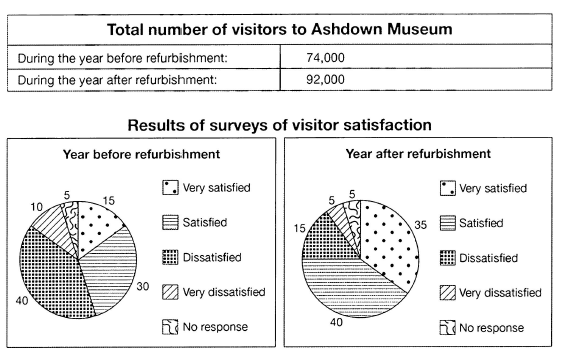
The table below shows the numbers of visitors to Ashdown Museum during the year before and the year after it was refurbished. The charts show the result of surveys asking visitors how satisfied they were with their visit, during the same two periods.
Summarise the information by selecting and reporting the main features, and make comparisons where relevant.
Student answer (Band 6.0)
The table illustrates the total number of visitors to Ashdown Museum during the year before and year after refurbishment. Two pie charts give the information about the results of surveys of visitor satisfaction.
Overall, the number of guests increased, also their satisfaction dramatically rosed in the second year, while the dissatisfaction decreased.
In the year before the museum was refurbished, 74.000 person have visited it, after the transformations, it surged to 92.000 person.
However, a considerable improvements happened to the surveys of reviews, where it went from only 15% very satisfied, to 35%. The satisfied category that was 30%, become the largest share in the year after with 40%. However, the percentage of dissatisfied vistors significantly declined from 40% to just 15%, also the very dissatisfied share diminued to 5% when it was 10% the year before refurbishment. Th remain part is for the people who decided to be conservative about their response which is only 5% in both years.
AI examiner evaluation
| Criterion | Band |
|---|---|
| Task Achievement / Task Response | 7.0 |
| Coherence and Cohesion | 6.0 |
| Lexical Resource | 5.5 |
| Grammatical Range and Accuracy | 5.5 |
| Overall | 6.0 |
Task Achievement / Task Response: Band 7.0
You cover the main features accurately: visitor numbers rose from 74,000 to 92,000, satisfaction increased, and dissatisfaction fell. The overview identifies the broad contrast, and the body includes the key survey figures, including the unchanged 5% with no response. This gives a clear, relevant account of both the table and charts. To make the report more fully developed, state explicitly that satisfied visitors became the largest group after refurbishment, while dissatisfied visitors were the largest group before it. Also avoid the unsupported interpretation that non-respondents “decided to be conservative”; the chart only records that they gave no response. The figures are otherwise grounded in the visual data.
Coherence and Cohesion: Band 6.0
The response has a clear overall arrangement: an introduction, an overview, and details comparing visitor totals and satisfaction categories. The sequence from the total number of visitors to the survey results is easy to follow. However, cohesion is sometimes mechanical or unclear. “However” is used to introduce information that is not a contrast, and “also” joins ideas awkwardly in the overview and final comparison. The reference “where it went from only 15% very satisfied” is also unclear because “it” does not clearly refer to the survey or category. Use more precise links such as “Meanwhile” or “By contrast,” and name the category directly to make relationships between figures clearer.
Lexical Resource: Band 5.5
You use relevant task vocabulary such as “refurbishment,” “visitor satisfaction,” “percentage,” and “declined,” and the meaning is generally clear. There is some variety in how you describe change, including “increased,” “surged,” and “declined.” However, several word choices and collocations are inaccurate or informal for a data report: “guests” is less precise than “visitors,” “reviews” does not accurately describe survey satisfaction, and “be conservative about their response” misinterprets no response. Spelling and word-form errors such as “vistors,” “diminued,” and “Th remain” also reduce control. Choose precise chart terminology and check spelling before submitting.
Grammatical Range and Accuracy: Band 5.5
You attempt a mix of simple and more complex structures, including a relative clause in “the satisfied category that was 30%” and a comparison using “from … to …”. The main trends remain understandable, but some grammatical errors occur across the response. For example, “satisfaction dramatically rosed” has an incorrect verb form, and “74.000 person have visited” has problems with number agreement and tense. In “the satisfied category … become the largest share,” the verb form is incorrect, while “when it was 10% the year before” is an awkwardly formed comparison. Practise accurate past-tense reporting and plural agreement, and use complete, clearly structured comparison clauses.
See this exact question answered at other band scores. The same prompt compared across bands.
Browse more IELTS Writing model answers or get your own writing scored by the same AI examiner.