Band 6.0 IELTS Writing Task 1 Model Answer
Overall Band Score: 6.0 · Cambridge IELTS 11 · 2026-11-13
IELTS Writing Task 1 question
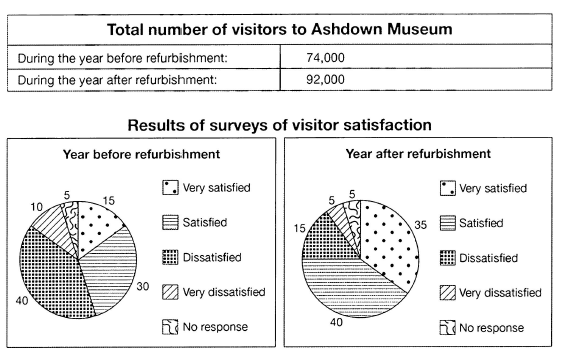
The table below shows the numbers of visitors to Ashdown Museum during the year before and the year after it was refurbished. The charts show the result of surveys asking visitors how satisfied they were with their visit, during the same two periods.
Summarise the information by selecting and reporting the main features, and make comparisons where relevant.
Student answer (Band 6.0)
The chart illustrate the annual number of visitors to the Ashdown Museum before and after it's renovation. Alongside, it shows the surveys results of satisfaction levels of visitors during the same two periods.
Overall, there is an significant increase in the number of visitors after the renovation of the museum. Furthermore, the satisfaction level of many visitors noticed a positive trend such as very satisfied rising and dissatisfied guests declining.
Following the refurbishment the annual visitors increased significantly by 18000. Showing that renovation to museum attracted a lot more visitors.
Regarding visitor satisfaction, the number of very satified visitors rose from 15% to 35% representing an increase of 20 percentage points. Similarly, the figure of satisfied increased from 30% to 40%. In contrast the proportion of dissatisfied visitors reduced from 40% to 15% showing decline of 25 percentage points. Very dissatisfied visitors also decreased from 10% to 5%. Notably the the number of no response visitors reduced from 5% to zero after the renovation of the museum.
AI examiner evaluation
| Criterion | Band |
|---|---|
| Task Achievement / Task Response | 7.0 |
| Coherence and Cohesion | 6.5 |
| Lexical Resource | 5.5 |
| Grammatical Range and Accuracy | 5.5 |
| Overall | 6.0 |
Task Achievement / Task Response: Band 7.0
You cover the main features and make accurate comparisons: visitor numbers rose from 74,000 to 92,000, while satisfaction improved, with “very satisfied” increasing from 15% to 35% and “dissatisfied” falling from 40% to 15%. The overview identifies both the rise in attendance and the positive shift in satisfaction, and the response reports the other survey categories as well. One factual error weakens precision: “no response” remained at 5%, rather than reducing to zero. The overview could also distinguish the overall positive shift more clearly by noting that satisfied and very satisfied responses together became the majority. Overall, the key information is selected and supported, though this misreading and some generalisation limit the precision of the account.
Coherence and Cohesion: Band 6.5
The response has a clear overall structure: an introduction, an overview, attendance figures, and then satisfaction comparisons. This makes the information easy to follow, and transitions such as “Regarding visitor satisfaction” and “In contrast” help signal the shift and comparison. The organisation is effective, but progression within the attendance paragraph is less smooth: “Following the refurbishment…” is followed by the fragment “Showing that renovation…” rather than a complete, connected explanation. Some linking is also mechanical, with “Similarly” and “In contrast” doing much of the work. To strengthen cohesion, combine closely related points into complete sentences and use clearer references, while keeping the useful category-by-category structure.
Lexical Resource: Band 5.5
You use relevant task vocabulary, including “refurbishment,” “satisfaction levels,” “proportion,” and “percentage points,” which helps communicate the comparisons. However, several noticeable spelling and word-choice problems reduce precision: “satified” is misspelled, “the surveys results” is an awkward phrase, and “the number of no response visitors” is not a natural description of a survey category. “Positive trend” is understandable but broad; more precise language would describe satisfaction as having improved or the share of dissatisfied respondents as having fallen. The range is sufficient to discuss the chart, but some phrasing is repetitive and collocations are not consistently natural. Focus on accurate spelling and standard expressions for proportions and survey responses.
Grammatical Range and Accuracy: Band 5.5
The response communicates its main comparisons, but grammatical control is uneven and sentence structures are mostly simple. There are errors in agreement and articles in “The chart illustrate” and “there is an significant increase.” The sentence “Showing that renovation to museum attracted a lot more visitors” is a fragment, and “the number of satisfied increased” lacks a clear noun after “satisfied.” There is some attempt at more complex comparison, particularly “In contrast the proportion…,” but punctuation and sentence construction need more consistent control. Practise forming complete sentences and checking subject–verb agreement, articles, and noun phrases; these changes would make the data easier to read without altering its meaning.
See this exact question answered at other band scores. The same prompt compared across bands.
Browse more IELTS Writing model answers or get your own writing scored by the same AI examiner.