Band 5.5 IELTS Writing Task 1 Model Answer
Overall Band Score: 5.5 · Cambridge IELTS 11 · 2026-11-13
IELTS Writing Task 1 question
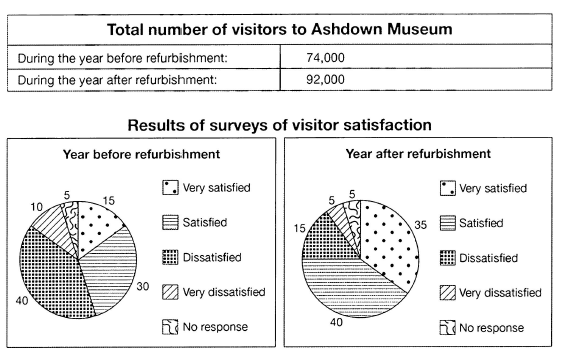
The table below shows the numbers of visitors to Ashdown Museum during the year before and the year after it was refurbished. The charts show the result of surveys asking visitors how satisfied they were with their visit, during the same two periods.
Summarise the information by selecting and reporting the main features, and make comparisons where relevant.
Student answer (Band 5.5)
The table given below explains the number of visitors to Ashdown Museum during the year before and the year after it was refurbished. The pie-chart demonstrates the results of survey asking visitors how satisfied they were visiting museum before and after renovation.
Overall, the tabel shows that number of visitors was high during the year after renovation which is 92,000. Before the year of refurbishment, 40% visitors were dissatisfied, 30% were satisfied and 5% visitors gave no response. The survey results of after renovation years show 35% visitors were very satisfied and 40% were satisfied ,15% were dissatisfied.
During the year before renovation 74,000 visitors were recorded and during the year after renovation of museum 92,000 people visited. The survey results before and after the year of renovation shows that 15%visitors were very satisfied before and 35% were very satisfied after, 5% gave no reponse before and after renovation ,10% were very dissatisfied before and 5% show dissatisfaction after, 40% were dissatsfied before and 15% show dissatifaction after renovation, 30% were satisfied before and 40% were satisfied after renovation.
In conclusion, number of dissatisfied visitors decrease after refurbishment.
AI examiner evaluation
| Criterion | Band |
|---|---|
| Task Achievement / Task Response | 5.5 |
| Coherence and Cohesion | 5.0 |
| Lexical Resource | 5.5 |
| Grammatical Range and Accuracy | 5.0 |
| Overall | 5.5 |
Task Achievement / Task Response: Band 5.5
You cover both the visitor totals and the satisfaction surveys, and most figures are accurate: visitors rose from 74,000 to 92,000, while dissatisfaction fell from 40% to 15%. Your overview identifies the higher post-refurbishment attendance and the decline in dissatisfaction. However, the overview is not fully balanced: it would be clearer to state that satisfaction increased overall, including the rise in the “very satisfied” group from 15% to 35%. The report also omits the 10% “very dissatisfied” figure before refurbishment and the 5% figure after, although not every value needs to be listed. Some comparisons are repeated rather than selected and developed, so the main trends are only partly highlighted.
Coherence and Cohesion: Band 5.0
The response has a recognisable structure, with an introduction, an overview, supporting details and a concluding sentence. The information is generally grouped by topic, and phrases such as “before renovation” and “after renovation” help readers follow the comparisons. However, progression is weakened by repetition: the visitor totals appear in both the overview and the next paragraph, and several survey figures are restated more than once. The final sentence repeats the decline in dissatisfaction rather than adding a useful summary. Some linking is also awkward, as in “The survey results before and after the year of renovation shows,” which makes the relationship between the data less clear. Grouping the figures into positive and negative responses would create a more purposeful sequence.
Lexical Resource: Band 5.5
You use relevant vocabulary for describing the topic, including “refurbished,” “survey results,” “visitors,” and “dissatisfied,” so the main information remains understandable. There is some variation in referring to the renovation, but several choices are imprecise or repetitive: “pie-chart” is singular although the task presents two charts, and “show dissatisfaction” is less direct than naming the “very dissatisfied” category. Spelling errors such as “tabel,” “reponse,” “dissatsfied,” and “dissatifaction” are noticeable and reduce accuracy. Phrases such as “number of visitors was high” are also vague when the exact comparison is available. Aim for accurate category labels and a wider set of precise reporting verbs and trend expressions.
Grammatical Range and Accuracy: Band 5.0
You attempt both simple statements and longer sentences, and the reader can usually understand the comparisons. However, the range is limited and longer constructions are often not controlled accurately. For example, “The survey results … shows” has a subject–verb agreement error, while “40% visitors” and “number of visitors” need articles or other grammatical support. The opening sentence, “The pie-chart demonstrates the results of survey asking visitors how satisfied they were visiting museum,” contains several missing articles and an awkward clause structure. Punctuation and spacing are also inconsistent, including the comma before a space in “satisfied ,15%.” Build accuracy first with clear comparative sentences, then practise combining them using correctly formed clauses and articles.
See this exact question answered at other band scores. The same prompt compared across bands.
Browse more IELTS Writing model answers or get your own writing scored by the same AI examiner.