Band 5.5 IELTS Writing Task 1 Model Answer
Overall Band Score: 5.5 · Cambridge IELTS 11 · 2026-11-13
IELTS Writing Task 1 question
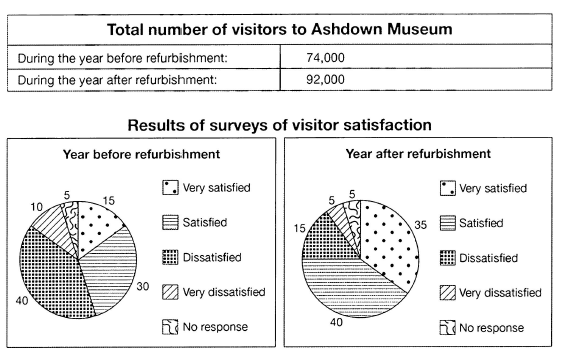
The table below shows the numbers of visitors to Ashdown Museum during the year before and the year after it was refurbished. The charts show the result of surveys asking visitors how satisfied they were with their visit, during the same two periods.
Summarise the information by selecting and reporting the main features, and make comparisons where relevant.
Student answer (Band 5.5)
The table illustrate the numbers of visitors to Ashdown Museum during the year before and the year after it was refurbished. The charts show the result of surveys asking visitors how satisfied they were with their visit, during the same two periods.
Overall, a major number of visitors are vist during the year after refurbishment. At the same time, many people satisfied to the after refurbishment Museum. In contrast, a vast average of visitors dissatisfied before refurbishment.
Initially, number of visitors are vist after refurbishment vist time is higher than the befor refurbishment time visitors. However, during the year befor refurbishment and during the year after refurbishment has 18,000 differences between them. When we talk about the visitor satisfaction, refurbishment before people shows the higher percebtage of people are dissatisfied. Whereas after the refurbishment that perecntage is turining to the satisfied. It about 40%. Furthermore, after refurbishment people very satisfied percentage is higher than the before refurbishment. It shows 20% differences between them. Meanwhile, befor refurbishment very satisfied and after refurbishment dissatisfied has the equal percentages. It about 15%. Moreover, befor refurbishment and after refurbishment visitors no response percentages are moderately equal. Besides this, after refurbishment ver dissatisfied percentage is lower than the before refurbishment percentage.
In summary, a majority of visitors are vist to Ashdown Museum during the year after refurbishment. At the same time, many people satisfied with the development and improvement than before refurbishment.
AI examiner evaluation
| Criterion | Band |
|---|---|
| Task Achievement / Task Response | 6.5 |
| Coherence and Cohesion | 6.0 |
| Lexical Resource | 5.0 |
| Grammatical Range and Accuracy | 5.0 |
| Overall | 5.5 |
Task Achievement / Task Response: Band 6.5
You cover both the visitor totals and the satisfaction surveys, and your overview identifies the main contrast: attendance rose after refurbishment while dissatisfaction was more common beforehand. Several comparisons are accurate, including the 20-point rise in “very satisfied” responses, the unchanged 5% with no response, and the fall in dissatisfaction. However, the visitor increase is 18,000, not a percentage difference, and the statement that “many people satisfied” after refurbishment would be clearer if it reported both satisfied categories (40% satisfied and 35% very satisfied). The claim that before-refurbishment very satisfied and after-refurbishment dissatisfied shares are equal is also inaccurate: they are 15% and 15%, respectively, so this comparison is correct, but should be expressed precisely. More exact reporting and fuller coverage of the key figures would strengthen the response.
Coherence and Cohesion: Band 6.0
The response has a recognisable structure: an introduction, an overview, a paragraph of comparisons, and a concluding summary. Linking expressions such as “However,” “Whereas,” and “Furthermore” help signal contrasts, and the reader can follow the broad movement from attendance to satisfaction. At times, though, the progression is repetitive: the conclusion repeats the overview, while the main paragraph moves between figures without a consistently clear order. Some links are also awkward or unclear, particularly “It about 40%” and “Meanwhile, before refurbishment very satisfied and after refurbishment dissatisfied has the equal percentages.” Organise the survey data in a more systematic sequence—positive responses, negative responses, then no response—and use clear references to each period to make comparisons easier to follow.
Lexical Resource: Band 5.0
You use relevant task vocabulary, including “visitors,” “refurbishment,” “percentage,” “dissatisfied,” and “no response,” so the topic is generally understandable. However, the range and control are limited, with repeated use of “visitors,” “percentage,” and “after refurbishment,” and several inaccurate or unnatural expressions. For example, “a major number” is not a natural way to describe an increase, and “a vast average” does not convey the intended meaning. Spelling errors such as “befor,” “percebtage,” and “perecntage” also reduce accuracy. Aim for precise chart language and natural collocations, such as “the number of visitors increased” and “the proportion of dissatisfied respondents fell.” Varying reporting verbs and comparison phrases would make the description more fluent.
Grammatical Range and Accuracy: Band 5.0
You attempt some complex sentence forms, including contrasts introduced by “Whereas” and “At the same time,” and the overall meaning is usually recoverable. However, grammatical control is inconsistent, with errors in verb forms, agreement, articles, and sentence construction. For example, “The table illustrate” needs subject–verb agreement, while “a major number of visitors are vist” has an incorrect verb form and an unclear structure. Phrases such as “during the year before refurbishment and during the year after refurbishment has 18,000 differences” also lack a clear grammatical relationship between the periods and the increase. Some fragments, including “It about 40%,” make the data harder to interpret. Practise accurate simple comparison sentences first, then combine them using subordinate clauses and check each sentence for a complete subject and verb.
See this exact question answered at other band scores. The same prompt compared across bands.
Browse more IELTS Writing model answers or get your own writing scored by the same AI examiner.