Band 6.0 IELTS Writing Task 1 Model Answer
Overall Band Score: 6.0 · Cambridge IELTS 11 · 2026-11-13
IELTS Writing Task 1 question
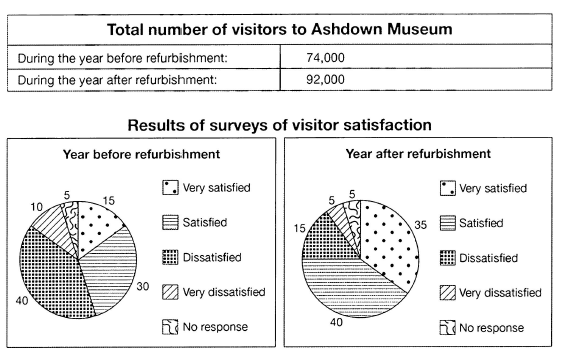
The table below shows the numbers of visitors to Ashdown Museum during the year before and the year after it was refurbished. The charts show the result of surveys asking visitors how satisfied they were with their visit, during the same two periods.
Summarise the information by selecting and reporting the main features, and make comparisons where relevant.
Student answer (Band 6.0)
The table chart provides the data regarding the numebr of visitors to Ashdown Museum before and after renovation and the pie chart illustrate the propotion of how satisfied are they with the new development in the given periods.
Overall, An increase in number of visitors is being notices after the refurbishment.and the dominating number of visitors are satisfied with new changes.
Firstly, Before transformation almost 74,000 people visit to museum in a year simaltaniously, which increased upto 92,000 after the transformation. which is a sign of huge development.
On the other hand, As a result of survey took a year before renovation showes that 40% of people were not satisfied with their visit and only 30% were satisfied and 15% were very satisfied from the visit and 10% were very dissatisfied and 5% havenot given any response. However, after renovation whole result changed almost 35% visitors were very satisfied and 40% were satisfied. While, 15% were still dissatisfied and 5% were very dissatisfied were as visitors who does not give any respond remain same.
AI examiner evaluation
| Criterion | Band |
|---|---|
| Task Achievement / Task Response | 7.0 |
| Coherence and Cohesion | 6.5 |
| Lexical Resource | 5.5 |
| Grammatical Range and Accuracy | 5.0 |
| Overall | 6.0 |
Task Achievement / Task Response: Band 7.0
You cover both the visitor totals and the satisfaction surveys, and the main comparisons are accurate: attendance rose from 74,000 to 92,000, while satisfaction increased and dissatisfaction declined. Your overview identifies the rise in visitors and the more positive post-refurbishment results. The figures you select for both survey periods are also consistent with the chart. To make the report more fully developed, state the overall shift more precisely—for example, that satisfied or very satisfied visitors became the majority after refurbishment, whereas dissatisfaction had been the largest response before it. Avoid evaluative claims such as “a sign of huge development,” which go beyond what the data itself demonstrates; focus instead on describing the measurable changes and their scale.
Coherence and Cohesion: Band 6.5
The response has a recognisable progression: an introduction, an overview, and then details about attendance and survey results. “Firstly” and “However” help signal the movement between points, and the reader can follow the main comparisons. This meets the lower level of coherent overall arrangement, with some evidence of more purposeful organisation. However, several transitions are awkward or incorrectly punctuated, such as “after the refurbishment.and” and “While,” before the final comparison. The survey figures are packed into one long sentence, making the relationships between categories harder to track. Use separate sentences or clearer grouping for positive and negative responses, and connect each comparison directly to its relevant year.
Lexical Resource: Band 5.5
You use some task-relevant vocabulary, including “refurbishment,” “visitors,” “satisfied,” and “dissatisfied,” so the topic remains clear. However, the range is limited and several noticeable spelling, word-form, and collocation errors reduce precision: “numebr,” “propotion,” “visit to museum,” and “survey took a year before” are examples. Phrases such as “new development” and “whole result changed” are vague for describing survey data. Aim for accurate, natural reporting language and check spelling carefully. More precise terms such as “visitor numbers,” “satisfaction levels,” and “the proportion of respondents” would help you describe the figures without relying on general wording.
Grammatical Range and Accuracy: Band 5.0
You attempt both simple and more complex sentence forms, including a comparison with “which increased” and a contrast introduced by “However.” Nevertheless, errors are frequent and sometimes make the relationships between ideas difficult to follow. For example, “the pie chart illustrate” has subject–verb disagreement, while “40% of people were not satisfied … and only 30% were satisfied” is embedded in an awkward sentence beginning “As a result of survey took.” Sentence boundaries and punctuation are also unreliable, as in “after the refurbishment.and” and the fragment-like “which is a sign of huge development.” Practise building complete sentences with clear subjects and verbs, and use full stops to separate the survey comparisons.
See this exact question answered at other band scores. The same prompt compared across bands.
Browse more IELTS Writing model answers or get your own writing scored by the same AI examiner.