Band 5.0 IELTS Writing Task 1 Model Answer
Overall Band Score: 5.0 · Cambridge IELTS 11 · 2026-11-14
IELTS Writing Task 1 question
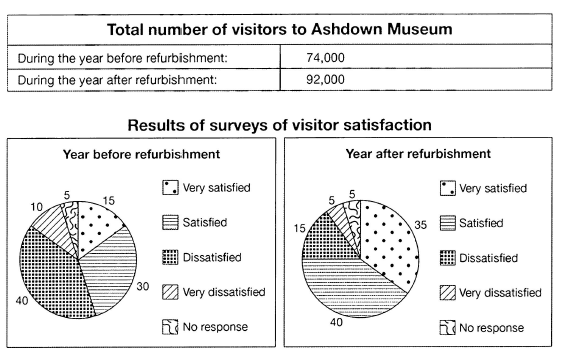
The table below shows the numbers of visitors to Ashdown Museum during the year before and the year after it was refurbished. The charts show the result of surveys asking visitors how satisfied they were with their visit, during the same two periods.
Summarise the information by selecting and reporting the main features, and make comparisons where relevant.
Student answer (Band 5.0)
The charts demonstrates the numbers of visitors to Ashdown Museum during year before and the year after it was renovated.The charts actually illustrates surveys asking visitors how much satisfied they were with their visit,during the same two periods.
Overall,the year after refurbishment the numbers of visitors were recorded to be the highest of about 92,000 people because of having more facilties in the Musuem than before.Initially,people were not as much satisfied as after development of Ashdown and numbers recorde was 74,000 during that period of time.
Earlier when the Museum was its previous state,about 40 percent of visitors often looked dissatisfied and 10 percent of people were seen very dissatisfied about 5 percent of people were left with no response or with no reviews.They might have experienced more dissatifaction but they leave without any comment.Only 15 percent of folks were looked impressive and satisfied thats because pf the building of museum and 30 percent were satisfied enough.
Later,during the year after the renovation,it has been reported that number of visitors significantly increased from 15 to 40 percent of people seems like more satisfed about 35 percent are satisfed and 5 percent people are left with no comment.Moreover, only 15 and 5 percent of the visitors were dissatisfied looking.
Therefore, we can conclude people enjoy when they get valuable things.
AI examiner evaluation
| Criterion | Band |
|---|---|
| Task Achievement / Task Response | 5.5 |
| Coherence and Cohesion | 5.0 |
| Lexical Resource | 5.0 |
| Grammatical Range and Accuracy | 5.0 |
| Overall | 5.0 |
Task Achievement / Task Response: Band 5.5
You cover both the visitor totals and the satisfaction surveys, and the main figures are mostly reported accurately: visitors rose from 74,000 to 92,000, while dissatisfaction fell from 40% to 15%. However, the overview includes an unsupported explanation that the increase was “because of having more facilities,” and the conclusion that people enjoy “valuable things” is too general to summarise the data. There is also a confusing comparison in the final paragraph: satisfaction did not increase “from 15 to 40 percent”; 15% were very satisfied before refurbishment, while 40% were satisfied afterwards. The response identifies relevant trends, but some details and interpretations are unclear or under-developed. Focus the overview on the rise in attendance and the shift towards satisfaction, without adding causes not shown in the charts.
Coherence and Cohesion: Band 5.0
The response has a recognisable sequence: an introduction, an overall statement, and paragraphs about the two periods. This gives the reader some organisation, and words such as “Overall,” “Earlier,” and “Later” help signal movement through the data. However, progression is weakened by unclear links between ideas and by sentences that combine several figures without a clear comparison. For example, the sentence beginning “Later, during the year after the renovation” mixes the change from 15% to 40% with the separate figures for very satisfied and satisfied visitors. Some linking phrases, including “Therefore,” introduce a broad conclusion rather than a data-based summary. Group the figures by satisfaction level and compare before with after in a consistent order.
Lexical Resource: Band 5.0
You use some task-relevant vocabulary, including “refurbishment,” “visitors,” “dissatisfied,” and “increased,” so the topic is generally understandable. However, the range is limited and several word choices or collocations are inaccurate, sometimes making the meaning difficult to follow. “People were looked impressive” does not clearly describe a survey response, while “numbers recorde” and “more satisfed” contain noticeable spelling errors. “How much satisfied” is also an unnatural expression. Avoid informal terms such as “folks” in this report and use precise labels from the chart, such as “very satisfied” and “no response.” More accurate, consistent vocabulary for describing proportions and changes would make the comparisons clearer.
Grammatical Range and Accuracy: Band 5.0
You attempt both simple and more extended sentence forms, but errors are frequent and sometimes make relationships between figures hard to understand. The opening has subject–verb disagreement in “The charts demonstrates” and “The charts actually illustrates,” and it omits articles in “during year before.” Sentence boundaries and punctuation are also unreliable: there are missing spaces after full stops and commas, and some long sentences run several ideas together. In “the year after refurbishment the numbers of visitors were recorded to be the highest,” the phrasing and structure are awkward; a direct comparison would be clearer. Practise accurate subject–verb agreement, articles, and sentence punctuation, then use shorter sentences to report each comparison before attempting more complex structures.
See this exact question answered at other band scores. The same prompt compared across bands.
Browse more IELTS Writing model answers or get your own writing scored by the same AI examiner.