Band 6.0 IELTS Writing Task 1 Model Answer
Overall Band Score: 6.0 · Cambridge IELTS 11 · 2026-11-15
IELTS Writing Task 1 question
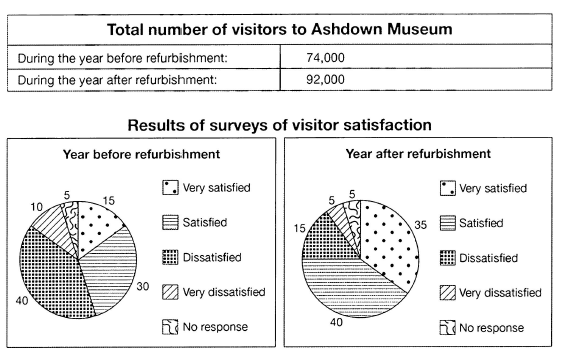
The table below shows the numbers of visitors to Ashdown Museum during the year before and the year after it was refurbished. The charts show the result of surveys asking visitors how satisfied they were with their visit, during the same two periods.
Summarise the information by selecting and reporting the main features, and make comparisons where relevant.
Student answer (Band 6.0)
The table provides the data about the number of Ashdown Museum's visitors during the year before and the year after it was reconstructed. The other two pie charts illustrate the outcomes of a survey of visitor's satisfaction level, how they were satisfied, during the same two years.
Overall, it can be seen that the highest number of people visits the museum than before the reconstruction. More visistors were dissatisfied and very few individuals gave no response, during the both periods.
74,000 people visit Ashdown museum before, while a higher number of people came to see after its renovation, which was 92,000. Earlier, visitors with proportion of 15% were very satisfied but about 35% afterward. More people were satisfied during both periods, which were 30% and 40%.
The visitors who were dissatisfied with museum about 40% and it dropped to 15% after reconstruction. Very dissatisfied people were about 10% before refurbishment, which decreased to 5% later, while only 5% of people did not give any response about the museum.
AI examiner evaluation
| Criterion | Band |
|---|---|
| Task Achievement / Task Response | 6.5 |
| Coherence and Cohesion | 6.5 |
| Lexical Resource | 5.5 |
| Grammatical Range and Accuracy | 5.5 |
| Overall | 6.0 |
Task Achievement / Task Response: Band 6.5
You cover both the visitor totals and the satisfaction results, and the figures you report are accurate: attendance rose from 74,000 to 92,000, while satisfaction increased and dissatisfaction declined. The overview identifies the rise in visitors and notes the small no-response share, although “More visitors were dissatisfied” is not a clear summary of the overall change: dissatisfaction was higher before refurbishment, not after. You also say “More people were satisfied during both periods,” but the chart shows satisfaction was the largest category only after refurbishment; before it, dissatisfaction was highest. To strengthen the response, make the overview compare the overall shift from dissatisfaction to satisfaction and distinguish the two periods more precisely.
Coherence and Cohesion: Band 6.5
The response has a clear overall arrangement: an introduction, an overview, and two paragraphs presenting the visitor totals and survey figures. This makes the information easy to locate, and contrasts such as “before, while” and “it dropped to 15% after reconstruction” help show change. However, the overview’s statement that more visitors were dissatisfied is unclear in relation to the later, accurate figures, so the progression of the main message is weakened. Some links are also awkward or repetitive, including “during the both periods” and the repeated use of “before” and “after.” Make the overview consistent with the data, and use clearer references to the two years to improve cohesion.
Lexical Resource: Band 5.5
You use relevant task vocabulary, including “survey,” “proportion,” “dissatisfied,” and “refurbishment,” and the reader can generally understand the comparisons. However, several word choices and collocations are inaccurate or unnatural, such as “reconstructed” for a museum that was refurbished, “the outcomes of a survey of visitor’s satisfaction level,” and “came to see after its renovation.” There are also spelling errors in “visistors” and “museum” is inconsistently capitalised as a proper name. These issues make the range seem limited and reduce precision, despite some appropriate topic vocabulary. Aim for natural chart-reporting phrases such as “visitor numbers,” “satisfaction levels,” and “the proportion of respondents,” and check spelling and word forms carefully.
Grammatical Range and Accuracy: Band 5.5
You attempt a mix of sentence forms, including comparisons with “while” and a relative clause in “which decreased to 5% later.” The main figures and trends remain understandable, but some grammatical errors recur. For example, “the highest number of people visits” has a subject–verb agreement problem, and “during the both periods” uses an incorrect article pattern. In “The visitors who were dissatisfied with museum about 40%,” the sentence lacks a complete verb structure and an article. Tense is also inconsistent in “people visit” and “people came.” Use past tense consistently for the two completed periods, and check articles, agreement, and complete sentence structure. More accurate control of these patterns would make your comparisons clearer.
See this exact question answered at other band scores. The same prompt compared across bands.
Browse more IELTS Writing model answers or get your own writing scored by the same AI examiner.