Band 5.0 IELTS Writing Task 1 Model Answer
Overall Band Score: 5.0 · Cambridge IELTS 11 · 2026-11-15
IELTS Writing Task 1 question
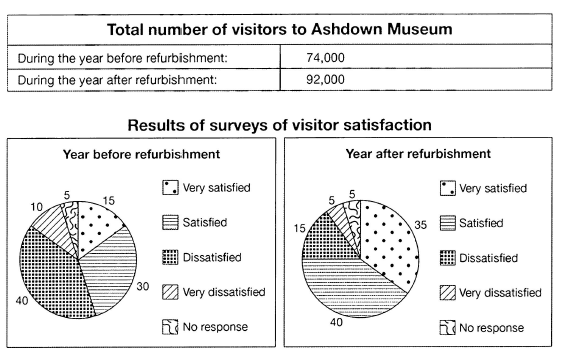
The table below shows the numbers of visitors to Ashdown Museum during the year before and the year after it was refurbished. The charts show the result of surveys asking visitors how satisfied they were with their visit, during the same two periods.
Summarise the information by selecting and reporting the main features, and make comparisons where relevant.
Student answer (Band 5.0)
the charts illustrates by which the percentages of before and after the refurbisment of the museum in two periods
overall, the year before refurbisment and after refurbisment of mesum expericence the population increases , while the stready increasesfrom 74000 to 92000
Before the refurbishment of museum the people is 40% dissatisfied and 10% is very dissatisfed and 5% is no responed and 30% prople are satisfied and 15% is only people is very statisfied
but after the refurbishment of the museum the people is very statisfed the ratio of peolpe whose is very statisfed is 35% as comparied before its become double and statisfedd people is 40% which means amlost any people like it and dissatief also be half and its become 15% only and very distatised is 5% and there is same also 5 % which people no respone
AI examiner evaluation
| Criterion | Band |
|---|---|
| Task Achievement / Task Response | 5.5 |
| Coherence and Cohesion | 5.5 |
| Lexical Resource | 5.0 |
| Grammatical Range and Accuracy | 4.5 |
| Overall | 5.0 |
Task Achievement / Task Response: Band 5.5
You report the main visitor total accurately, rising from 74,000 to 92,000, and include all five satisfaction categories for both periods. The key shift is also apparent: dissatisfaction falls while satisfaction rises. However, the overview is unclear and repeats the visitor increase rather than clearly summarising the survey’s overall change. Some comparisons are inaccurate or imprecise: 35% very satisfied is not double 15% (it is more than double), and saying “almost any people like it” is not supported by the figures. The response also contains 140 words, below the required 150, so the report is under-length. Develop a concise overview and explain the most important contrasts more precisely.
Coherence and Cohesion: Band 5.5
There is a basic sequence: an opening, an attempted overview, then details for the year before and after refurbishment. This gives the reader some way to follow the comparison. However, the progression is weakened by unclear sentence boundaries and links between ideas. The opening, “the charts illustrates by which,” does not clearly introduce the information, while the overview repeats the visitor increase without connecting it to the satisfaction results. The long final sentence joins several figures with “and” and “also,” making the comparisons difficult to track. Use separate paragraphs for the overview and details, and group related figures—for example, compare satisfied categories together, then dissatisfied categories. Clearer linking phrases would make the organisation less repetitive.
Lexical Resource: Band 5.0
You use some relevant task vocabulary, including “refurbishment,” “dissatisfied,” “satisfied,” “ratio,” and “increases,” so the topic is generally recognisable. However, the range is limited and several word choices or spellings make the report harder to understand, such as “expericence the population increases,” “statisfedd,” and “no respone.” Some expressions are also unnatural or imprecise: “the people is very satisfied” and “almost any people like it” do not describe survey proportions clearly. Choose standard terms such as “the proportion of visitors” and “survey respondents,” and check spelling carefully. More precise comparison language, such as “rose to” and “fell to,” would help you report the data accurately and avoid repeating “people.”
Grammatical Range and Accuracy: Band 4.5
The response attempts to compare two periods and uses some basic sentence patterns, but grammatical control is weak and errors frequently make relationships between figures unclear. For example, “the charts illustrates” has subject–verb disagreement, and “the year before refurbishment and after refurbishment … experience” has an unclear subject and verb construction. In “the people is 40% dissatisfied,” the sentence pattern does not correctly express a percentage of visitors. The final sentence also runs several clauses together without clear punctuation, obscuring the comparisons. Practise forming accurate sentences with “X% of visitors were…” and “the figure for … rose/fell to…”. Use full stops to separate comparisons and check agreement, articles, and verb forms.
See this exact question answered at other band scores. The same prompt compared across bands.
Browse more IELTS Writing model answers or get your own writing scored by the same AI examiner.