Band 5.5 IELTS Writing Task 1 Model Answer
Overall Band Score: 5.5 · Cambridge IELTS 11 · 2026-11-15
IELTS Writing Task 1 question
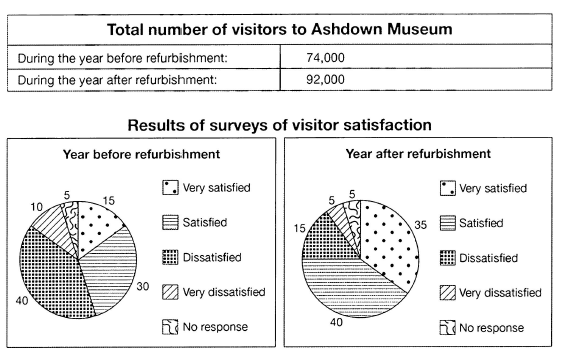
The table below shows the numbers of visitors to Ashdown Museum during the year before and the year after it was refurbished. The charts show the result of surveys asking visitors how satisfied they were with their visit, during the same two periods.
Summarise the information by selecting and reporting the main features, and make comparisons where relevant.
Student answer (Band 5.5)
the table chart illustrates the numbers of people visiting Ashdown museum in two separated years. Moreover, the pie charts demonstrate the result of surveys asking guests how pleased they were with their visit, during the same two periods.
overall, the percentage of visitors before refurbished who were satisfied, was not much bigger then the dissatisfied people whereas the percentage of the pleased people were incresed more then the dissatisfied visitors.
the year before renoation, the total number of visitors was 74000.furthuremore, the percentage of very satisfied and satistied people were 15 and 30. the visitors who were very disappointed was 10 percent and the guest who were dissatisfied was 40 percent.The people who did not comment was 5 percent.
after the year, the museum had 92000 visitors. the people who were very pleased by the museum was 35 percent. Moreover, the satisfied people's percentage was 40 percent whereas the dissatisfied and very dissatisfied people's percentage was 15 and 5 percent. The rest of them did not responsed.
AI examiner evaluation
| Criterion | Band |
|---|---|
| Task Achievement / Task Response | 6.0 |
| Coherence and Cohesion | 5.5 |
| Lexical Resource | 5.5 |
| Grammatical Range and Accuracy | 5.0 |
| Overall | 5.5 |
Task Achievement / Task Response: Band 6.0
You cover both the visitor totals and the satisfaction surveys, and the figures you report are accurate: attendance rose from 74,000 to 92,000, while satisfaction increased and dissatisfaction declined. Your overview identifies this broad contrast, which is an important feature. However, it is not expressed clearly: “the percentage of visitors before refurbished who were satisfied, was not much bigger then the dissatisfied people” is difficult to interpret, and the overview does not explicitly summarise the rise in total attendance. The account also gives the survey figures one by one rather than selecting and comparing the most significant changes—for example, very satisfied visitors rose from 15% to 35%, while dissatisfied visitors fell from 40% to 15%. A clearer overview and more direct comparisons would make the key features more fully developed.
Coherence and Cohesion: Band 5.5
The response has a recognisable structure: an introduction, an overview, and separate paragraphs for the two periods. This makes the information broadly easy to follow. However, progression within the report is somewhat mechanical, with repeated lists of categories rather than comparisons across the two years. Linking words such as “Moreover” and “Furthermore” are used, but they do not always show the relationship between the figures; “Moreover” before the second set of survey results, for instance, adds little. Some references are also unclear, particularly “the rest of them,” which refers to visitors who gave no response but could be stated directly. Grouping positive and negative responses and comparing their changes would create a more coherent flow.
Lexical Resource: Band 5.5
You use relevant vocabulary for the topic, including “visitors,” “surveys,” “satisfied,” “dissatisfied,” and “percentage,” so the main subject is generally understandable. There is also some attempt to vary wording with “guests,” “pleased,” and “very disappointed.” However, several choices are inaccurate or unnatural for describing survey categories: “very disappointed” does not match “very dissatisfied,” and “people visiting” is less precise than “visitors.” Spelling errors such as “incresed,” “furthuremore,” “renoation,” and “responsed” are noticeable, while “separated years” is an awkward description of the two periods. Aim for consistent, accurate chart terminology and check spelling; this will make the report more precise and fluent.
Grammatical Range and Accuracy: Band 5.0
You attempt both simple sentences and longer structures, including a comparison with “whereas,” and the reader can usually understand the intended information. However, grammatical control is uneven, with errors in agreement, tense, articles, and sentence boundaries. For example, “the percentage … was 15 and 30” should use a plural subject such as “the percentages … were,” while “the people who were very pleased … was 35 percent” has a subject–verb agreement error. The opening overview also has an awkward clause structure, and “after the year” does not clearly establish the time reference. Punctuation is inconsistent, including missing spaces after full stops. Practise accurate comparative sentences and check each sentence for a clear subject and matching verb.
See this exact question answered at other band scores. The same prompt compared across bands.
Browse more IELTS Writing model answers or get your own writing scored by the same AI examiner.