Band 5.5 IELTS Writing Task 1 Model Answer
Overall Band Score: 5.5 · Cambridge IELTS 11 · 2026-11-15
IELTS Writing Task 1 question
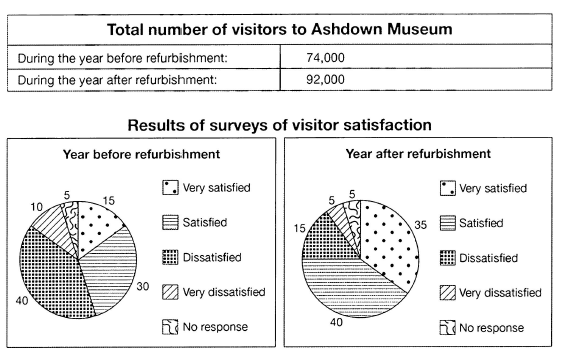
The table below shows the numbers of visitors to Ashdown Museum during the year before and the year after it was refurbished. The charts show the result of surveys asking visitors how satisfied they were with their visit, during the same two periods.
Summarise the information by selecting and reporting the main features, and make comparisons where relevant.
Student answer (Band 5.5)
The table illustrates the total number of visitors to Ashdown Museum between before and after the year and the charts compare the results of surveys of visitors satisfaction during the same period.
Overall, the table demonstrates the refurbishment before and after the year , moreover the charts depicts the refurbishment in the same periods.
At first, according to the table the amount of visitors to Ashdown Museum significantly increased from 74000 to 92000 and it measured between before refurbisment and after refurbishment during the year.
Similarly, the proportion of very satisfied level highly increased from 15 to 35 between the refurbishment before and after year . Also the satisfied level slightly climbed from 30 to 40 in the same periods. Simultaneously, the proportion of dissatisfied level significantly fall from 40 to 15 .Moreover, the another proportion which name is very dissatisfied level moderately decreased from 10 to 5. But the no response proportion remained stable during the same periods.
AI examiner evaluation
| Criterion | Band |
|---|---|
| Task Achievement / Task Response | 5.5 |
| Coherence and Cohesion | 5.5 |
| Lexical Resource | 5.5 |
| Grammatical Range and Accuracy | 5.5 |
| Overall | 5.5 |
Task Achievement / Task Response: Band 5.5
You identify the main overall changes: visitor numbers rose from 74,000 to 92,000, satisfaction increased, and dissatisfaction declined. The figures you give for the survey categories are accurate, and you also note that non-response stayed unchanged. However, the overview is unclear: “the table demonstrates the refurbishment before and after the year” does not state the key trends, and the charts are described as depicting the refurbishment rather than survey results. The response therefore reports relevant details but does not present the main features clearly or fully. Make the overview explicit—for example, say that attendance and positive ratings rose while negative ratings fell—and distinguish the survey percentages from the visitor totals.
Coherence and Cohesion: Band 5.5
The response has a basic structure, moving from an introduction and overview to the visitor total and then the survey results. Linking expressions such as “Similarly,” “Also,” and “But” help show some relationships between points. However, progression is weakened by the unclear overview and by awkward or repetitive transitions, including “At first” and “in the same periods.” The opening overview repeats the idea of refurbishment without summarising the data, so it does not guide the reader. Group the positive ratings together, then the negative ratings and unchanged response rate, and use clear comparisons to connect them. More purposeful paragraphing and referencing would make the information easier to follow.
Lexical Resource: Band 5.5
You use some relevant task vocabulary, including “proportion,” “increased,” “decreased,” and “remained stable,” which allows the reader to understand the broad trends. However, word choice and collocation are often inaccurate or unnatural: “visitors satisfaction,” “satisfied level,” and “the another proportion which name is” make the description less clear. “The table demonstrates the refurbishment” also misrepresents what the table shows. Spelling errors such as “refurbisment” further reduce accuracy. Aim for standard chart language and precise category names, such as “visitor satisfaction,” “the proportion who were satisfied,” and “the share of very dissatisfied visitors.” This would make your limited but relevant vocabulary more effective.
Grammatical Range and Accuracy: Band 5.5
You attempt both simple and more extended sentences, and the reader can generally identify the comparisons you intend. However, errors occur frequently in sentence structure, agreement, articles, and punctuation. For example, “the charts depicts” has a subject–verb agreement error, while “the another proportion” uses an incorrect article. The opening phrase “between before and after the year” is also grammatically unclear, and several sentences contain awkwardly placed or missing punctuation, as in “15 to 35 between the refurbishment before and after year .” These problems sometimes make the relationships between time periods difficult to follow. Practise accurate comparative sentence patterns, such as “The proportion rose from 15% before refurbishment to 35% afterwards.”
See this exact question answered at other band scores. The same prompt compared across bands.
Browse more IELTS Writing model answers or get your own writing scored by the same AI examiner.