Band 5.5 IELTS Writing Task 1 Model Answer
Overall Band Score: 5.5 · Cambridge IELTS 11 · 2026-11-17
IELTS Writing Task 1 question
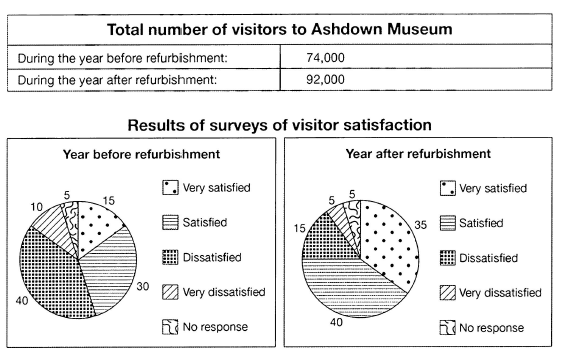
The table below shows the numbers of visitors to Ashdown Museum during the year before and the year after it was refurbished. The charts show the result of surveys asking visitors how satisfied they were with their visit, during the same two periods.
Summarise the information by selecting and reporting the main features, and make comparisons where relevant.
Student answer (Band 5.5)
The pie charts provides the proportion of satisfaction levels of different individuals about their visit in Ashdown museum during the year before refurbished and after. The table provides the information about the total number of visitors before and after of refurbishment.
Overall, The data collected by surveys have changed significantly between both years. The total number of visitors has increased, While other factors such as satisfaction levels have represented change. THE number of satisfaction levels has increased, very satisfaction numbers have also become more then double.
Year before the refurbishment, people very satisfied was just 15 but , after the refurb process they become 35 with the increase of 20. While satisfied accounted for 30 then they increase and become just 40. Dissatisfaction numbers were most dominant recoreded 40 then they decrease to just 15 in the next year. Followed by very dissatisfied was 10 then they decreased by half numbers and become 5. No response got the lowest attention in surveys which remains the same in both years.
AI examiner evaluation
| Criterion | Band |
|---|---|
| Task Achievement / Task Response | 6.0 |
| Coherence and Cohesion | 6.0 |
| Lexical Resource | 5.5 |
| Grammatical Range and Accuracy | 5.0 |
| Overall | 5.5 |
Task Achievement / Task Response: Band 6.0
You cover the main features of both the visitor total and the satisfaction surveys, and the figures you report are generally accurate: visitors rose from 74,000 to 92,000, very satisfied responses increased from 15 to 35, and dissatisfaction fell from 40 to 15. The overview also identifies an overall change, although “the number of satisfaction levels has increased” is unclear: the chart shows proportions in each category, not a total number of satisfaction levels. The overview would be stronger if it directly summarised the main contrast—satisfaction improved while dissatisfaction declined—and noted that satisfied responses also rose from 30 to 40. Some details, such as the unchanged 5% with no response, are relevant, but the key trends are not consistently synthesised.
Coherence and Cohesion: Band 6.0
The response has a recognisable structure: an introduction, an overview, and a paragraph describing the survey categories. This gives the information a coherent overall arrangement. You also use basic links such as “While,” “Followed by,” and “Overall” to connect points. However, some connections are awkward or unclear, particularly “While other factors such as satisfaction levels have represented change” and “Followed by very dissatisfied,” which interrupt the progression. The overview repeats the idea of change without clearly organising the positive and negative trends. Grouping the two satisfaction categories together, then the two dissatisfaction categories, would make comparisons easier to follow. Use linking words to show precise relationships rather than placing them at the start of fragments.
Lexical Resource: Band 5.5
You use relevant vocabulary for describing the charts, including “proportion,” “accounted for,” “dominant,” and “decrease,” so the reader can understand the main comparisons. However, several word choices and collocations are inaccurate or unnatural, such as “satisfaction levels of different individuals,” “after of refurbishment,” “very satisfaction numbers,” and “lowest attention in surveys.” These choices sometimes make the intended meaning less precise. There are also spelling and word-form problems, including “recoreded” and “refurb process.” Aim for standard chart language such as “share of respondents,” “after the refurbishment,” and “the lowest proportion.” More accurate collocations and consistent forms would make your vocabulary more effective and flexible.
Grammatical Range and Accuracy: Band 5.0
You attempt both simple and more complex sentence forms, including comparisons with “While” and clauses describing changes over time. The main information is usually understandable, but some grammatical errors recur. For example, “The pie charts provides” has subject–verb disagreement, while “people very satisfied was just 15” lacks a correct clause structure. Articles and prepositions are also problematic in “during the year before refurbished” and “after of refurbishment.” Capitalisation and punctuation are inconsistent, as in “Overall, The” and “While” after a comma. Practise forming complete comparison sentences with a clear subject and verb—for example, “The proportion of very satisfied visitors rose from 15% to 35%.” Greater control of these patterns would improve accuracy.
See this exact question answered at other band scores. The same prompt compared across bands.
Browse more IELTS Writing model answers or get your own writing scored by the same AI examiner.