Band 5.0 IELTS Writing Task 1 Model Answer
Overall Band Score: 5.0 · Cambridge IELTS 11 · 2026-11-17
IELTS Writing Task 1 question
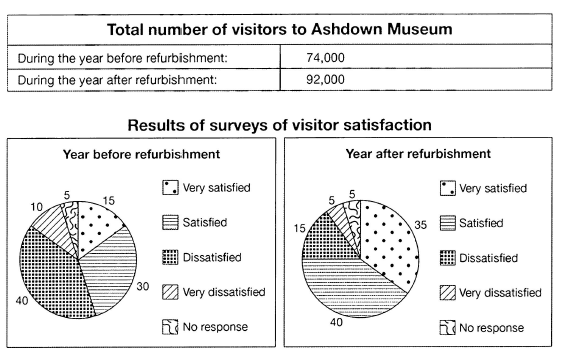
The table below shows the numbers of visitors to Ashdown Museum during the year before and the year after it was refurbished. The charts show the result of surveys asking visitors how satisfied they were with their visit, during the same two periods.
Summarise the information by selecting and reporting the main features, and make comparisons where relevant.
Student answer (Band 5.0)
The pie chart illustrate the numbers of visitors to Ashdown Museum between the year before and the year after it was change.The pie chart illustrate the result of reserch saying visitors how satisfied they were with their visit,during the aqual two periods.
Overall, it is clearly seen that the numbers of Satisfide and Very satisfied numbers refurbishment increased sharply in year.While the numbers of Dissatisfied and very dissatisfied in dicline slightly years ,wheares the numbers of no respone in two yars constant.
According to te graph it is crystal obvious,very satisfied of the numbers 15, satisfied 30, dissatisfied 40 and very dissatisfied 10 and no response 5, in year before refurbishment .
It is apparently seen that very satisfied 35, satisfied 40, dissatisfied 15 very diss atisfied 5 and no response 5 in after year refurbishment.
The most striking feature of chart is the no response is constent this is not chang our numbers in two years after and before.
AI examiner evaluation
| Criterion | Band |
|---|---|
| Task Achievement / Task Response | 4.5 |
| Coherence and Cohesion | 5.0 |
| Lexical Resource | 5.0 |
| Grammatical Range and Accuracy | 4.5 |
| Overall | 5.0 |
Task Achievement / Task Response: Band 4.5
You report the main satisfaction figures for both years accurately, including the rise in very satisfied responses from 15% to 35% and the fall in dissatisfied responses from 40% to 15%. You also identify the unchanged 5% with no response. However, the overview is unclear and partly inaccurate: dissatisfaction did not decline only “slightly,” and the response omits the important increase in total visitors from 74,000 to 92,000. Calling the visuals “pie chart[s]” also misidentifies the table and survey charts. The response is 142 words, below the 150-word minimum; 19 words copied from the prompt were excluded from the count. Add a clear overview and compare the visitor totals and the largest changes.
Coherence and Cohesion: Band 5.0
There is some organisation: the response begins with an introduction, gives an overview, and then reports figures for the two periods. This makes the basic comparison possible. However, progression is limited because the figures are presented in separate lists rather than grouped to highlight changes, and the final sentence repeats the point about no response already made in the overview. Linking is also awkward in phrases such as “in year before refurbishment” and “in after year refurbishment,” so relationships between the data are not always smooth. Use a concise overview followed by a paragraph comparing the key increases and decreases, and avoid repeating the same feature.
Lexical Resource: Band 5.0
You use some task-relevant vocabulary, including “refurbishment,” “satisfied,” “dissatisfied,” and “increased,” which helps convey the survey categories and trends. However, the range is limited and several word-choice, collocation, and spelling problems make the report less clear: “the pie chart illustrate” mislabels the visuals, “result of reserch” is not an appropriate description of a survey, and “numbers of Satisfide” is an awkward phrase. There are also repeated misspellings such as “respone,” “constent,” and “dicline.” Use accurate terms such as “table,” “survey results,” “proportions,” and “rose/fell,” and check spelling carefully.
Grammatical Range and Accuracy: Band 4.5
The response communicates some basic comparisons through simple clauses, but grammatical control is weak and the sentence patterns are repetitive. Errors occur frequently, including subject–verb agreement in “The pie chart illustrate,” missing or incorrect articles and prepositions in “in year before refurbishment,” and faulty sentence construction in “this is not chang our numbers.” Punctuation and spacing are also inconsistent, with missing spaces after full stops and commas. These problems sometimes make the intended relationships difficult to follow. Practise accurate simple sentences first, then combine them with controlled comparative structures, for example: “Visitor numbers rose from 74,000 to 92,000, while the proportion who were dissatisfied fell.”
See this exact question answered at other band scores. The same prompt compared across bands.
Browse more IELTS Writing model answers or get your own writing scored by the same AI examiner.