Band 6.0 IELTS Writing Task 1 Model Answer
Overall Band Score: 6.0 · Cambridge IELTS 11 · 2026-11-18
IELTS Writing Task 1 question
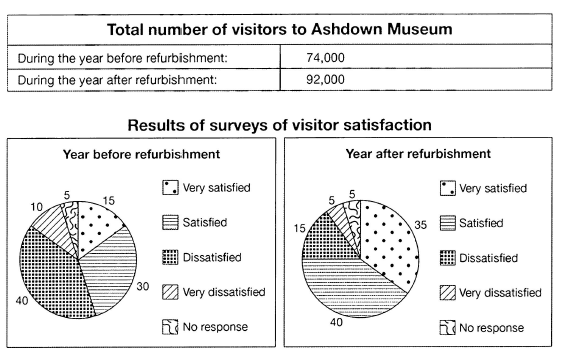
The table below shows the numbers of visitors to Ashdown Museum during the year before and the year after it was refurbished. The charts show the result of surveys asking visitors how satisfied they were with their visit, during the same two periods.
Summarise the information by selecting and reporting the main features, and make comparisons where relevant.
Student answer (Band 6.0)
The two pie charts compares satisfaction level of visitors before and after refurbishment of Ashdown Meseum with further classification with number of visitor given in the table.
Overall,40% of the result of survey accounted for very dissatisfied and 5% didn't gave any responds before the refurbishment.In comparision, 40% were completely satisfied meanwhile 5% didn't gave any response after refurbishment. The number of visitors during the year before refurbishment were 74,000 which has growth to 92000 after refurbishment.
Since 40% of the survey were dissatisfied before refurbishment which after decreased to 15%. Around 10% were completely dissatisfied before refurbishment which was also declined to 5%. In contrast 5% of the survey didn't gave any responds at both time.
There was huge growth in the satisfaction of people. 15% of the survey were very satisfied before refurbishment which increased to 35%.Similarly, 30% of survey were satisfied before refurbishment which later incresed to 40%.
AI examiner evaluation
| Criterion | Band |
|---|---|
| Task Achievement / Task Response | 7.0 |
| Coherence and Cohesion | 6.5 |
| Lexical Resource | 5.5 |
| Grammatical Range and Accuracy | 5.5 |
| Overall | 6.0 |
Task Achievement / Task Response: Band 7.0
You cover the main features and make relevant comparisons: visitor numbers rose from 74,000 to 92,000, dissatisfaction fell, and both satisfaction categories increased. The figures you report match the chart. Your overview identifies the broad improvement, although it would be clearer and more balanced if it stated directly that overall satisfaction rose while dissatisfaction declined, rather than focusing on individual percentages. The phrase “40% ... were completely satisfied” after refurbishment is inaccurate: 40% were satisfied, while 35% were very satisfied. You also describe the 40% before refurbishment as “very dissatisfied” in the overview, but it represents dissatisfied visitors. These category-label slips weaken precision, even though the response addresses the task and selects the key trends.
Coherence and Cohesion: Band 6.5
The response has a recognisable progression: an introduction, an overview, and paragraphs comparing dissatisfaction and satisfaction. Linking phrases such as “In contrast” and “Similarly” help signal comparisons, and the reader can follow the main trends. However, the overview mixes a category error with the visitor total, and the final paragraph repeats figures already introduced rather than developing a clearly organised comparison. Some transitions are also awkward or mechanically attached, as in “There was huge growth ... 15% ... increased to 35%.Similarly”. To strengthen progression, group the two satisfaction categories together and the two dissatisfaction categories together, and use a concise overview before the detailed figures.
Lexical Resource: Band 5.5
You use relevant task vocabulary, including “refurbishment”, “survey”, “dissatisfied” and “increased”, so the main information is generally understandable. However, several word-choice, collocation and spelling problems make the language less precise: “further classification with number of visitor” is unnatural, “didn't gave any responds” is incorrect, and “huge growth in the satisfaction” is an imprecise description of a percentage change. “Completely satisfied” also does not accurately label the chart’s “satisfied” category. Spelling slips such as “Meseum”, “comparision” and “incresed” are noticeable. Aim for standard chart-reporting phrases such as “the proportion of visitors who were satisfied” and check spelling and word forms carefully.
Grammatical Range and Accuracy: Band 5.5
You attempt both simple and more complex sentence forms, including comparisons with “which” and “meanwhile”, and most of the intended meaning can be understood. However, errors recur in agreement, verb forms, articles and sentence boundaries. For example, “The two pie charts compares” should use a plural verb, while “which has growth to 92000” has an incorrect verb construction. In “didn't gave”, the verb after “didn't” should be in its base form; “the number ... were” also has subject–verb disagreement. Punctuation and spacing need attention in “Overall,40%” and “35%.Similarly”. Use shorter, controlled sentences where needed, then check each subject–verb pair and the verb form after auxiliaries.
See this exact question answered at other band scores. The same prompt compared across bands.
Browse more IELTS Writing model answers or get your own writing scored by the same AI examiner.