Band 5.0 IELTS Writing Task 1 Model Answer
Overall Band Score: 5.0 · Cambridge IELTS 11 · 2026-11-18
IELTS Writing Task 1 question
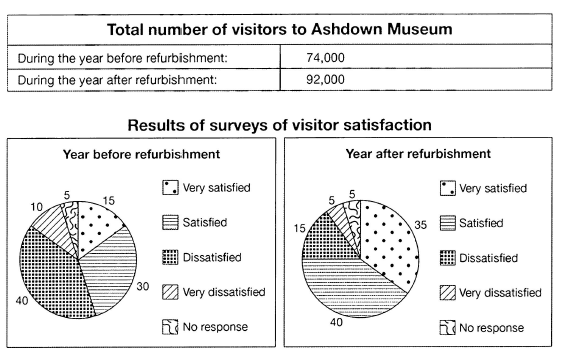
The table below shows the numbers of visitors to Ashdown Museum during the year before and the year after it was refurbished. The charts show the result of surveys asking visitors how satisfied they were with their visit, during the same two periods.
Summarise the information by selecting and reporting the main features, and make comparisons where relevant.
Student answer (Band 5.0)
Here this table is showing the numbers of visitors to Ashdown Museum during the year beefore and year after and chart shows the result of surveys asking visitors how satisfied they were with their visit, during the same two periods.
Here during the year before refurbishment, the total number of visitors to Ashdown Museum where count 74,000.We can see in chart there is different satisfiction results, there are 15% people Very Satisfied , 30% people just Satisfied, large amount of people Dissatisfied which is one of bigest percentage all of them which is 40%,there are 10% people very dissatisfied and finally also very low percentage all of them is No Response which percentage is 5%.
Now, we talking about total number of visitors to Ashdown Museum during the year after refurbishment, here total 92,000 vistores were counted.Also we can see in chart the percentage of Very Satisfied people is 35%, it is the second largest percentage in this year, the first largest is Satisfied which are 40%, regarding Dissatisfied their percentage is 15 then Very Dissatisfied their percentage have 10 and finally No Response also it is the lowest one percentage which is 5%.
So, about comparison there mostly results are very different for each other for both years but the results of Very Dissatisfied for both years are same which are 5 percent in both years.
AI examiner evaluation
| Criterion | Band |
|---|---|
| Task Achievement / Task Response | 5.0 |
| Coherence and Cohesion | 5.5 |
| Lexical Resource | 5.0 |
| Grammatical Range and Accuracy | 5.0 |
| Overall | 5.0 |
Task Achievement / Task Response: Band 5.0
You report the visitor totals accurately (74,000 before and 92,000 after) and include figures for all satisfaction categories, so the main data are recognisable. However, the response is largely a sequence of category-by-category details rather than a clear summary of the most important changes. The overview is weak: “mostly results are very different” is vague, and the final comparison incorrectly says very dissatisfied results were the same at 5% in both years; the earlier figure was 10%. The after-refurbishment figures otherwise match the chart. To strengthen the response, state the overall rise in visitors and the shift from dissatisfaction to satisfaction, then compare the largest changes accurately. The response addresses the task, but its key features and comparisons are limited and not always clear.
Coherence and Cohesion: Band 5.5
The response has a basic paragraph structure: it introduces the visuals, describes the first year, describes the second year, and ends with a comparison. This makes the information reasonably easy to locate. However, progression is mostly mechanical, with repeated openings such as “Here,” “Now,” and “Also we can see,” and the final paragraph does not effectively synthesise the preceding figures. Some links are awkward or unclear, for example “So, about comparison there mostly results are very different for each other.” Grouping the satisfaction categories into positive and negative responses would create a clearer line of comparison, while a concise overview near the beginning would help the reader follow the main message. Overall organisation is present, but cohesion and progression are uneven.
Lexical Resource: Band 5.0
You use relevant task vocabulary, including “refurbishment,” “percentage,” “visitors,” and the satisfaction labels, which allows the reader to understand the topic. However, the range is limited and several word choices or collocations are inaccurate or repetitive: “satisfiction results,” “bigest percentage,” “were counted,” and “very different for each other.” Spelling errors such as “beefore” and “vistores” also reduce accuracy. Repeating “percentage” and “people” makes the descriptions less precise. Aim to use natural chart-reporting phrases such as “accounted for,” “rose to,” and “the proportion of visitors who were satisfied,” and check spelling carefully. The vocabulary is sufficient to convey basic information, but noticeable errors and limited flexibility keep the descriptions from being consistently clear and precise.
Grammatical Range and Accuracy: Band 5.0
You attempt both simple statements and longer sentences, and the reader can generally identify the figures being reported. However, the range is limited, and longer constructions often contain errors. For example, “the total number of visitors … where count 74,000” has incorrect verb form and sentence structure; “the first largest is Satisfied which are 40%” has agreement problems; and “their percentage have 10” uses an incorrect verb form. Articles, punctuation, and sentence boundaries are also inconsistent, as in “74,000.We can see” and the long comma-linked descriptions. These errors sometimes make the relationships between ideas difficult to follow. Practise accurate comparative sentence patterns and use shorter, well-controlled sentences before adding more complex clauses.
See this exact question answered at other band scores. The same prompt compared across bands.
Browse more IELTS Writing model answers or get your own writing scored by the same AI examiner.