Band 6.0 IELTS Writing Task 1 Model Answer
Overall Band Score: 6.0 · Cambridge IELTS 11 · 2026-11-19
IELTS Writing Task 1 question
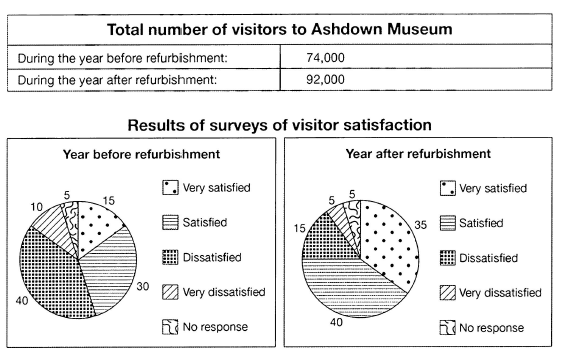
The table below shows the numbers of visitors to Ashdown Museum during the year before and the year after it was refurbished. The charts show the result of surveys asking visitors how satisfied they were with their visit, during the same two periods.
Summarise the information by selecting and reporting the main features, and make comparisons where relevant.
Student answer (Band 6.0)
The table illustrate the total number of visitors to Ashdown Museum in the year before and after refurbished, while the pie chart compares visitors level of satisfraction during same period of time.
Overall, the musium experience a significant increase in visitors numbers of following its refurbished. Forthermore the difference of visitors who were satisfied rose and dissatisfied declind.
In the other hand before the refurbished the mesium wellcomed 74000 visitors . This figure increased to 92000 in the following year , represents a rise of 18000 visitors .
Regarding visitors satisfraction 40% visitors were dissatisfied before refurbished and 10% were very dissatisfied then 30 % was satisfied also 15% were very satisfied but 5% doesnt have any responds.
After the refurbished dissatisfraction decline to 15% and very dissatisfied decline to 5% and very satisfied increase to 35% also satisfied increased to 40% and no respond remain same as 5%.
In conclusion the refurbished have positive impact on both visitors number and overall satisfraction.
AI examiner evaluation
| Criterion | Band |
|---|---|
| Task Achievement / Task Response | 6.5 |
| Coherence and Cohesion | 6.0 |
| Lexical Resource | 5.5 |
| Grammatical Range and Accuracy | 5.0 |
| Overall | 6.0 |
Task Achievement / Task Response: Band 6.5
You cover the main features and report the figures accurately: visitors rose from 74,000 to 92,000, while satisfaction increased and dissatisfaction fell. The overview identifies both the rise in attendance and the improved survey results, and you include all five response categories for each period. This gives the response a clear, relevant account of the data. To make the summary more fully developed, highlight the largest shifts explicitly—for example, the rise in “very satisfied” responses from 15% to 35% and the fall in “dissatisfied” responses from 40% to 15%. The conclusion that refurbishment had a positive impact is reasonable, but the charts show a correlation rather than proving the cause.
Coherence and Cohesion: Band 6.0
The response has a clear overall arrangement: an introduction, an overview, attendance figures, survey details, and a concluding statement. This makes the information easy to follow. However, some linking is mechanical or inaccurate, particularly “In the other hand,” and the repeated use of “also” to connect several figures. The survey paragraph lists categories in a long sequence, so comparisons are less prominent than they could be. Grouping the positive responses together and the negative responses together would create a clearer progression. Check that references such as “this figure” and “the difference of visitors” identify the intended data precisely, and use transitions such as “By contrast” or “Meanwhile” selectively.
Lexical Resource: Band 5.5
You use relevant task vocabulary, including “visitors,” “dissatisfied,” “increased,” and “decline,” and the reader can understand the main comparisons. However, spelling and word-choice errors are noticeable, including “satisfraction,” “musium,” “Forthermore,” and “responds.” Some phrases are also unnatural or imprecise: “the difference of visitors who were satisfied rose” and “the museum welcomed 74000 visitors” could be expressed more directly as changes in satisfaction and visitor totals. Use accurate forms such as “satisfaction,” “museum,” and “responses,” and choose standard chart language such as “the proportion of visitors who were satisfied.” Greater precision and more reliable spelling would strengthen the vocabulary.
Grammatical Range and Accuracy: Band 5.0
Your response includes both simple statements and some attempts to combine information, but grammatical control is uneven. Errors include subject–verb agreement in “The table illustrate” and “the museum experience,” missing or incorrect articles and prepositions in “before refurbished,” and faulty verb forms in “represents a rise” and “the refurbished have positive impact.” Several sentences also omit necessary grammatical words, as in “40% visitors were dissatisfied.” These errors sometimes make the relationships between figures less clear. Practise accurate past-tense reporting and complete sentence patterns—for example, “The table illustrates…” and “This represented a rise…”—while varying sentence structures without sacrificing accuracy.
See this exact question answered at other band scores. The same prompt compared across bands.
Browse more IELTS Writing model answers or get your own writing scored by the same AI examiner.