Band 6.5 IELTS Writing Task 1 Model Answer
Overall Band Score: 6.5 · Cambridge IELTS 11 · 2026-11-19
IELTS Writing Task 1 question
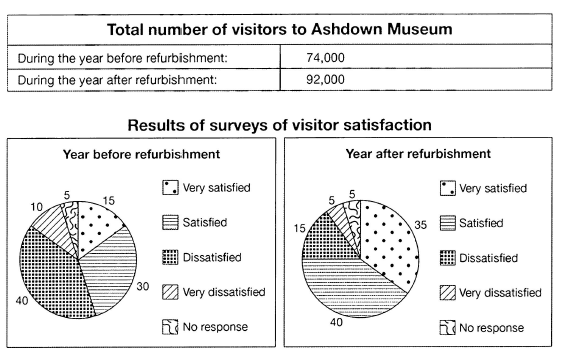
The table below shows the numbers of visitors to Ashdown Museum during the year before and the year after it was refurbished. The charts show the result of surveys asking visitors how satisfied they were with their visit, during the same two periods.
Summarise the information by selecting and reporting the main features, and make comparisons where relevant.
Student answer (Band 6.5)
The table provides the information about the number of people visited the Ashdown Museum before and after its refurbishment. The pie charts illustrate the results of visitor satisfaction surveys in five different levels, namely very satisfied, satisfied, dissatisfied, very dissatisfied and no response.
Overall, it is clear that more people visited museum after its renovation. The proportion of visitors satisfied with refurbishment has increased, while the percentage of people dissaisfied with changes has decreased.The percentage of individuals who gave no response remain same in both surveys.
To begin with table, 74,000 visitors came to the Ashdown Museum before its renovation and number of people who visited this museum after its refurbishment increased to 92,000.
Movind towards the pie chart, it is noticeable that 15% of visitors were very satisfied before refurbishment while, after renovation satisfication level raised to 35%. Similarly, the percentage of satisfied people increased from 30% to 40% after changing the interior of museum. Futhermore, 40% and 10% of them were dissatisfied and very dissatisfied with museum but the these percentages dropped to 15% and 10% after renovation. In both surveys, 5% of visitors gave no response.
AI examiner evaluation
| Criterion | Band |
|---|---|
| Task Achievement / Task Response | 7.0 |
| Coherence and Cohesion | 7.0 |
| Lexical Resource | 6.0 |
| Grammatical Range and Accuracy | 6.0 |
| Overall | 6.5 |
Task Achievement / Task Response: Band 7.0
You cover both the visitor totals and the satisfaction results, and the overview identifies the main shifts: attendance rose, satisfaction improved, dissatisfaction fell, and non-response stayed unchanged. Most figures are reported accurately, including the increase from 74,000 to 92,000 and the changes in the satisfied categories. However, there is one important numerical error: very dissatisfied visitors fell from 10% to 5%, not 10% after refurbishment. The phrase “satisfied with refurbishment” also slightly overstates what the survey measures, which is satisfaction with the visit. For a stronger report, check every comparison against the chart and describe the survey categories precisely; otherwise, the response selects and reports the key features clearly.
Coherence and Cohesion: Band 7.0
The response has a clear four-part structure: an introduction, an overview, and separate paragraphs for the table and charts. Its progression is easy to follow, and signposting such as “Overall,” “To begin with,” and “Similarly” helps connect the comparisons. The overview also gives the reader a useful summary before the details. Some linking is a little mechanical, particularly “Movind towards the pie chart,” and the final paragraph combines several figures in a way that makes the last comparison less precise. Use more natural transitions and group the satisfaction figures consistently—for example, report the two positive categories together, then the two negative categories—while keeping each comparison explicit.
Lexical Resource: Band 6.0
You use a suitable range of task-related vocabulary, including “refurbishment,” “proportion,” “percentage,” and “dissatisfied,” and the meaning remains clear throughout. There are, however, several spelling errors, such as “dissaisfied,” “Movind,” “satisfication,” and “Futhermore.” Some expressions are also imprecise or unnatural: “people visited” and “satisfied with refurbishment” do not describe the data as accurately as “visitors” and “satisfied with their visit.” “Changing the interior” introduces a detail not shown in the charts. Aim for accurate collocations and avoid adding explanations that the visual does not provide; careful proofreading would also improve control of spelling.
Grammatical Range and Accuracy: Band 6.0
You use a mix of simple and more complex forms, including the overview sentence beginning “while” and comparisons such as “increased from 30% to 40%.” These structures communicate the main information, but some grammatical errors remain. For example, “the number of people visited” needs a relative clause or a different construction, and “the percentage … remain same” has an agreement and article error. The sentence “but the these percentages dropped” contains an unnecessary article, while “before refurbishment while, after renovation” has awkward punctuation. Continue using varied sentence patterns, but check verb agreement, articles, and clause construction so that the comparisons read smoothly and accurately.
See this exact question answered at other band scores. The same prompt compared across bands.
Browse more IELTS Writing model answers or get your own writing scored by the same AI examiner.