Band 6.5 IELTS Writing Task 1 Model Answer
Overall Band Score: 6.5 · Cambridge IELTS 11 · 2026-11-19
IELTS Writing Task 1 question
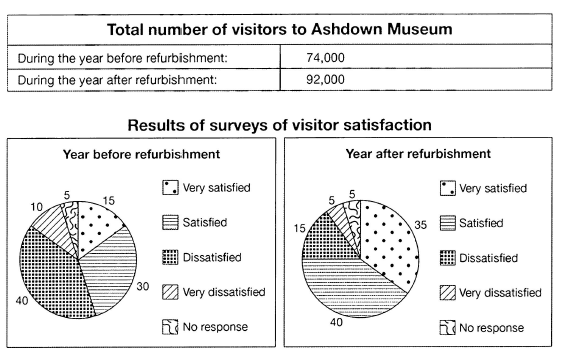
The table below shows the numbers of visitors to Ashdown Museum during the year before and the year after it was refurbished. The charts show the result of surveys asking visitors how satisfied they were with their visit, during the same two periods.
Summarise the information by selecting and reporting the main features, and make comparisons where relevant.
Student answer (Band 6.5)
The table and the pie charts here display the number of people visiting the Ashdown Museum during the year, befor and after it was renovated.
Overall, the number of visitors significantly rose after the Museum was renovated and the survey clearly indicates the large number of satisfied visitors after the remodeling.
During the restoration phase 74,000 people visited the Museum wherase after the renovation was done a total of 92,000 people attended the Museum.
The pie charts illustrate the very statisfied visitors increased from 15% to 35%. 40% of dissatisfied visitors were replaced by satisfied attendees and after the rehabilitation the dissatisfied visitors were down to 15%.The number of satisfied museumgoers surged from 30% to 40%. Very dissatsfied attendees went from 10% to 5% and people showing no response remained same befor and after the renovation.
In conclusion, more number of people were pleased with the renovation done on the museum.
AI examiner evaluation
| Criterion | Band |
|---|---|
| Task Achievement / Task Response | 7.0 |
| Coherence and Cohesion | 7.0 |
| Lexical Resource | 6.0 |
| Grammatical Range and Accuracy | 6.0 |
| Overall | 6.5 |
Task Achievement / Task Response: Band 7.0
You cover both the visitor totals and the satisfaction surveys, and the main comparisons are generally accurate: attendance rose from 74,000 to 92,000, very satisfied responses increased from 15% to 35%, and dissatisfaction fell. The overview identifies the broad rise in attendance and satisfaction, giving the report a clear central message. However, the statement that “40% of dissatisfied visitors were replaced by satisfied attendees” is not a precise description of the data: the dissatisfied share fell from 40% to 15%, while the satisfied share rose from 30% to 40%. The conclusion that visitors were pleased with the renovation also suggests a cause that the charts do not establish. Report the categories as separate changes and avoid inferring why they changed.
Coherence and Cohesion: Band 7.0
The response has a clear overall progression: an introduction, a broad overview, supporting figures, and a concluding statement. Information is grouped sensibly, and linking expressions such as “Overall,” “after,” and “In conclusion” help readers follow the comparison. The main limitation is that the final conclusion largely repeats the overview rather than adding a useful comparison, while the sentence about dissatisfied visitors being “replaced” by satisfied attendees combines two separate survey trends and makes their relationship unclear. Some transitions between the visitor totals and survey results could also be smoother. A more deliberate structure—overview first, then attendance figures, followed by the satisfaction categories grouped by their increases and decreases—would make the progression more precise and cohesive.
Lexical Resource: Band 6.0
You use a reasonable range of task-related vocabulary, including “renovated,” “restoration,” “rehabilitation,” “surged,” and “dissatisfied,” and the meaning is generally clear. There are, however, several spelling errors, including “befor,” “wherase,” “statisified,” and “dissatsfied,” which reduce accuracy. Some choices are also imprecise or unnatural for describing survey data: “attended the Museum” is less suitable than “visited,” and “replaced” implies that one group literally became another. “More number of people” is an awkward expression, and “large number of satisfied visitors” is less exact than describing the percentage. Aim for accurate, consistent terms such as “respondents” or “visitors who were satisfied,” and check spelling carefully.
Grammatical Range and Accuracy: Band 6.0
You attempt a mix of sentence forms, including a complex overview beginning “Overall” and comparisons using “from … to …”. Most of the message remains understandable, but some grammatical errors and punctuation problems are present. For example, “people showing no response remained same” needs an article (“remained the same”), and “more number of people were pleased” has an incorrect comparative construction. The sentence beginning “40% of dissatisfied visitors were replaced…” is also awkwardly structured, making the relationship between the figures unclear. In addition, a missing space after the full stop in “15%.The” disrupts punctuation. Work on articles, natural comparative patterns, and sentence boundaries while retaining the range of structures you already attempt.
See this exact question answered at other band scores. The same prompt compared across bands.
Browse more IELTS Writing model answers or get your own writing scored by the same AI examiner.