Band 6.0 IELTS Writing Task 1 Model Answer
Overall Band Score: 6.0 · Cambridge IELTS 11 · 2026-11-19
IELTS Writing Task 1 question
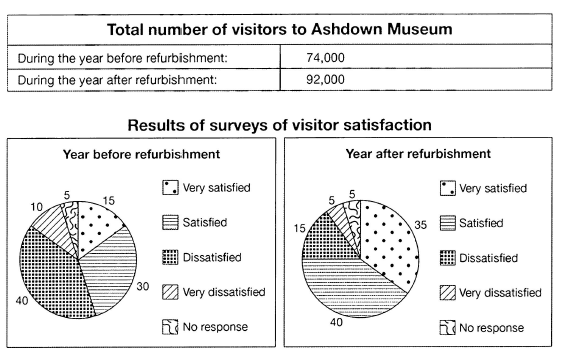
The table below shows the numbers of visitors to Ashdown Museum during the year before and the year after it was refurbished. The charts show the result of surveys asking visitors how satisfied they were with their visit, during the same two periods.
Summarise the information by selecting and reporting the main features, and make comparisons where relevant.
Student answer (Band 6.0)
The table shows the Ashdown Museum's visitor count during the past year and next year of its refurbishment and the chart shows visitors satisfaction of aforementioned in three five categories.
Overall, the table shows increase in total number of visitors after refurbishment. Likewise, the chart shows increase increase in visitors satisfaction compared to the year before refurbishment. The number of very satisfied visitors increased most which is almost twice of its previous state while the number of very dissatisfied and dissatisfied users followed the same trend in reverse. No response remained unchanged.
In terms of increase, the ratio of very satisfied visitors made the largest jump, from 15 to 35. Satisfaction rose from 30 to 40. Likewise, the number of visitors become 92,000, which was 74,000 before the year before refurbishment.
Regarding decrease, the ratio of dissatisfied visitors moved strongly, it become lesser than half after the refurbishment, from 40 to 15. Following a similar trend, the number of very dissatisfied user also become as low as 5, which was 10 previously.
AI examiner evaluation
| Criterion | Band |
|---|---|
| Task Achievement / Task Response | 6.5 |
| Coherence and Cohesion | 6.5 |
| Lexical Resource | 6.0 |
| Grammatical Range and Accuracy | 5.5 |
| Overall | 6.0 |
Task Achievement / Task Response: Band 6.5
You identify the main overall changes accurately: visitor numbers rose from 74,000 to 92,000, satisfaction improved, and the dissatisfied categories declined while no response stayed at 5%. You also report the key survey figures for all four satisfaction levels. This gives the response a clear, relevant account of the data. However, some comparisons are imprecise: “almost twice” understates the rise in very satisfied responses, which increased from 15% to 35%, and “the number of visitors become 92,000” does not clearly distinguish total visitors from survey percentages. The opening also misdescribes the periods as “past year and next year.” A more precise overview and clearer separation of totals from percentages would make the reporting more complete and developed.
Coherence and Cohesion: Band 6.5
The response has a coherent four-paragraph structure: an introduction, an overview, and separate paragraphs for increases and decreases. This makes the main comparisons easy to locate, and signposts such as “In terms of increase” and “Regarding decrease” help guide the reader. The progression is generally logical, but some linking is mechanical or repetitive, particularly the repeated use of “Likewise” and the paired increase/decrease framing. A few references are unclear: “the chart shows visitors satisfaction of aforementioned” does not clearly identify the survey results, and “it become lesser than half” requires the reader to infer what “it” refers to. Use more precise references and vary transitions to make cohesion smoother and less formulaic.
Lexical Resource: Band 6.0
You use enough task-related vocabulary to describe the main trends, including “increased,” “rose,” “dissatisfied,” and “remained unchanged.” The distinction between “very satisfied” and “very dissatisfied” is also maintained, so the data categories remain understandable. However, several choices are awkward or imprecise, such as “visitors satisfaction,” “aforementioned,” “ratio” for survey percentages, and “previous state.” “Made the largest jump” is understandable but less suitable for a formal report. These choices show attempts to vary vocabulary, but collocation and precision are not consistently controlled. Prefer standard chart language such as “the proportion of visitors,” “satisfaction levels,” and “compared with the previous year” to make the account more natural and exact.
Grammatical Range and Accuracy: Band 5.5
You attempt a mix of simple and more complex sentences, including the overview sentence beginning “The number of very satisfied visitors increased most…” and the comparison “from 15 to 35.” Most of the intended meaning can be followed, but some grammatical errors remain. For example, “the table shows increase” needs an article, and “the number of visitors become 92,000” has an incorrect verb form and tense. In “the number … was 74,000 before the year before refurbishment,” the time phrase is awkwardly constructed. There are also agreement and sentence-pattern problems in “the number of very dissatisfied user also become.” Check articles, past-tense forms, singular/plural agreement, and sentence boundaries; more consistently accurate control would strengthen the response.
See this exact question answered at other band scores. The same prompt compared across bands.
Browse more IELTS Writing model answers or get your own writing scored by the same AI examiner.