Band 5.5 IELTS Writing Task 1 Model Answer
Overall Band Score: 5.5 · Cambridge IELTS 11 · 2026-11-20
IELTS Writing Task 1 question
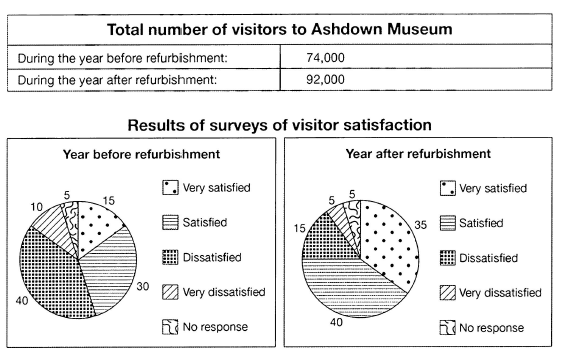
The table below shows the numbers of visitors to Ashdown Museum during the year before and the year after it was refurbished. The charts show the result of surveys asking visitors how satisfied they were with their visit, during the same two periods.
Summarise the information by selecting and reporting the main features, and make comparisons where relevant.
Student answer (Band 5.5)
The table below demonstrate the figures of individual who visited Ashdown museum during the year before and the year after it was established. The chart present the result of feedback asking visitors how they are satisfied with their visit. during the same two period.
Overall, it was noticed that before the refurbishment the highest ratio of tourist were dissatisfied. whereas, after development still the same percent of people were satisfied.
Looking into details, during the year before the total number of people was 74,000 who visited the Ashdown meseum. In which the higest ratio of 40% was accounted for the people who were not satisfied. While 30% of the people were satisfied. It was shown in the chart the 10% of tourist were very dissatisfied. additonally 15% indivisual were very satisfied with every things no complain. And 5% of people did not practicipated in the survery.
Moreover, Year after establishment of Ashdown meseum the same propotion of 40% was seen in chart was satisfied. The value of dissatisfied visitors decrease at 15%. while the percentage of very satisfied arose at 35%. No response was still stuck on the same ratio, and very dissatisfied decrease 5%.
AI examiner evaluation
| Criterion | Band |
|---|---|
| Task Achievement / Task Response | 5.5 |
| Coherence and Cohesion | 6.0 |
| Lexical Resource | 5.0 |
| Grammatical Range and Accuracy | 5.0 |
| Overall | 5.5 |
Task Achievement / Task Response: Band 5.5
You report the visitor totals accurately (74,000 before and 92,000 after) and include figures for all five satisfaction categories, so the response covers the main data. However, the overview is unclear and partly inaccurate: “the highest ratio of tourist were dissatisfied” describes the first year, but “after development still the same percent of people were satisfied” is ambiguous and does not clearly identify the main change. In fact, satisfaction rose overall, while dissatisfaction fell. Some details are also imprecise: 40% were dissatisfied before refurbishment, not simply “not satisfied,” and the after-refurbishment figures for both satisfied and dissatisfied visitors could be stated more clearly. A sharper overview comparing the overall shifts would make the key features more fully developed.
Coherence and Cohesion: Band 6.0
The response has a recognisable structure: an introduction, an overview, and separate paragraphs for the two periods. This gives the reader a basic route through the information, and phrases such as “Looking into details” and “Moreover” signal movement between sections. However, progression is sometimes weakened by unclear or mechanical linking. For example, “whereas” begins a sentence fragment after the overview, and “In which” does not clearly connect the visitor total to the satisfaction figures. The final paragraph lists changes without consistently comparing them with the earlier year. Use complete sentences and organise the body around direct before-and-after comparisons; this would make the relationships between figures easier to follow.
Lexical Resource: Band 5.0
You use some task-relevant vocabulary, including “refurbishment,” “dissatisfied,” “percentage,” and “decrease,” which helps communicate the chart’s subject. However, the range is limited and several word choices or collocations are inaccurate or awkward, such as “figures of individual,” “highest ratio of tourist,” “satisfied with every things,” and “stuck on the same ratio.” Spelling errors, including “meseum,” “higest,” “additonally,” and “survery,” are noticeable and reduce precision. Choose standard chart language such as “number of visitors,” “largest proportion,” and “remained unchanged.” More accurate use of these terms, alongside careful spelling, would make the report clearer and more appropriate for an academic summary.
Grammatical Range and Accuracy: Band 5.0
You attempt both simple and more complex forms, including “during the year before…” and a contrast introduced by “whereas.” However, sentence structures are often faulty or incomplete. “The chart present the result…” has subject–verb disagreement, while “whereas, after development still the same percent…” is not a complete, clear clause. Other examples include “In which the higest ratio…” and “It was shown in the chart the 10%…,” where clause structure is difficult to follow. Articles, plurals, and agreement also need attention, as in “the same two period” and “the highest ratio of tourist were.” Build each point as a complete sentence with a clear subject and verb, and check agreement and punctuation; this will improve accuracy while preserving your attempts at varied structures.
See this exact question answered at other band scores. The same prompt compared across bands.
Browse more IELTS Writing model answers or get your own writing scored by the same AI examiner.