Band 6.0 IELTS Writing Task 1 Model Answer
Overall Band Score: 6.0 · Cambridge IELTS 11 · 2026-11-20
IELTS Writing Task 1 question
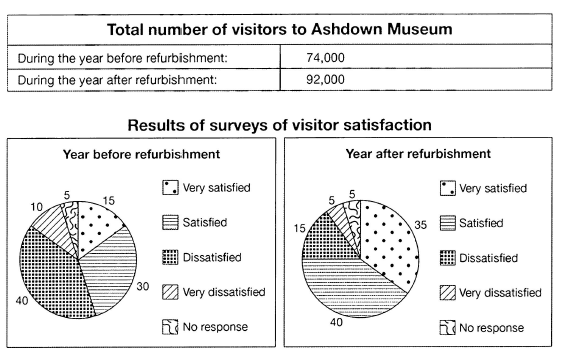
The table below shows the numbers of visitors to Ashdown Museum during the year before and the year after it was refurbished. The charts show the result of surveys asking visitors how satisfied they were with their visit, during the same two periods.
Summarise the information by selecting and reporting the main features, and make comparisons where relevant.
Student answer (Band 6.0)
The provided table illustrates total number of visitors to Ashdown Museum before and after the year of refurbishment. While chart tables provide a detailed breakdown of satisfaction level of people with their visit.
Overall, a decent rise in number of visitors is observed after year of refurbishment. Also a significant increase in satisfaction level of people is observed in after year.
From the table it is clear that the number of visiting people increases about 1/3 folds to that of previous value, in figures, touching the numerical value of 92,000.
Pie charts show the percentage wise breakdown of satisfaction level of peoples. Comparing both pie charts it is inferred that the percentage of people who are very satisfied shows an increment of 20 percent of its initial value (15%). The people which lied in category of satisfied also showed an increase from 30 to 40 percent. Conversely, the proportion of people in 'dissatisfied' and "very dissatisfied" groups showed a declination of 25% and 5% respectively, from initial values of 40% and 10%. While the people of "no response" category maintained their proportion of 5% across both years.
AI examiner evaluation
| Criterion | Band |
|---|---|
| Task Achievement / Task Response | 6.5 |
| Coherence and Cohesion | 6.5 |
| Lexical Resource | 5.5 |
| Grammatical Range and Accuracy | 5.5 |
| Overall | 6.0 |
Task Achievement / Task Response: Band 6.5
You cover both the visitor total and the satisfaction surveys, and your overview identifies the two main changes: attendance rose and satisfaction improved. Most figures are reported accurately, including the shift from 30% to 40% satisfied and the unchanged 5% giving no response. However, the visitor increase is described as “about 1/3 folds,” which is unclear and overstates the change: 74,000 to 92,000 is an increase of 18,000, or roughly a quarter. The statement that very satisfied visitors increased by “20 percent of its initial value” is also ambiguous; the share rose by 20 percentage points, from 15% to 35%. Your selection of key features is relevant, but clearer numerical comparisons and more precise reporting would make the account more fully developed.
Coherence and Cohesion: Band 6.5
The response has a recognisable structure: an introduction, an overview, and details comparing the two years. The overview helps the reader understand the main direction of change, and contrast markers such as “Conversely” support the comparison between positive and negative responses. Some links are less effective or mechanical, however. The opening sentence beginning “While chart tables…” is a fragment rather than a complete sentence, and “From the table” followed by “Pie charts show…” creates a somewhat list-like progression. The final “While” clause is also left without a main clause. Grouping the satisfaction figures into positive responses and negative responses, then comparing each group, would create a smoother progression and make the relationships between figures clearer.
Lexical Resource: Band 5.5
You use a reasonable range of task-related vocabulary, including “breakdown,” “proportion,” “increment,” and “maintained,” and the reader can generally understand the comparisons. However, several choices are unnatural or imprecise for describing charts. “Chart tables” is not an appropriate label, “visiting people” is awkward, and “declination” is not the natural term for a falling share. “1/3 folds” and “increment of 20 percent of its initial value” also make the intended numerical meaning difficult to follow. Aim for standard data-reporting collocations such as “the number of visitors,” “the proportion fell,” and “rose by 20 percentage points.” More accurate, natural phrasing would improve precision without requiring more elaborate vocabulary.
Grammatical Range and Accuracy: Band 5.5
You attempt a mix of sentence forms, including a comparison introduced by “While” and a sentence beginning “Comparing both pie charts.” Some structures are controlled, but errors in sentence construction and grammatical patterns remain noticeable. “While chart tables provide…” is a dependent clause without a main clause, and “While the people of ‘no response’ category…” has the same problem. In “an increase in satisfaction level of people is observed in after year,” the article and preposition pattern are faulty. There are also awkward constructions such as “the number of visiting people increases,” where the tense and phrasing do not fit the past-period comparison. Use complete sentences, maintain past tense for the two periods, and check articles and prepositions in phrases such as “in the year after refurbishment.”
See this exact question answered at other band scores. The same prompt compared across bands.
Browse more IELTS Writing model answers or get your own writing scored by the same AI examiner.