Band 5.5 IELTS Writing Task 1 Model Answer
Overall Band Score: 5.5 · Cambridge IELTS 11 · 2026-11-20
IELTS Writing Task 1 question
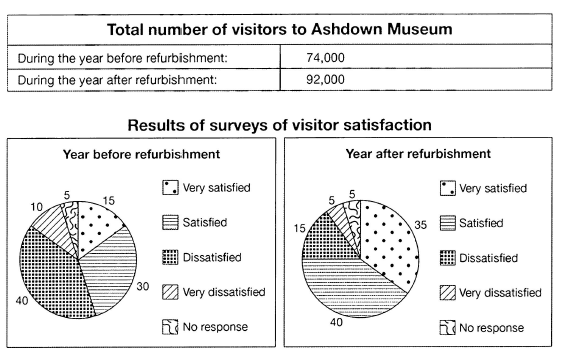
The table below shows the numbers of visitors to Ashdown Museum during the year before and the year after it was refurbished. The charts show the result of surveys asking visitors how satisfied they were with their visit, during the same two periods.
Summarise the information by selecting and reporting the main features, and make comparisons where relevant.
Student answer (Band 5.5)
The given chart illustrate the proportion of tourist to Ashdown museum during the year before more over the year after it was refurbished. it shows the analysis asking visitor how satisfide thet were eith their visit,during the same tow time periods.
To begin with the first chart shows the total number of visitors to ashdown museum which are as follows, there were 74,000 visitores during the year before refurbishment. Along with, there were 92,000 explorer after the year refurbishment.
On the second chart the there were result of surveys of satisfaied visitoers before the year. there were 15% of ratio for the most satisfied visitores.Along with, 30% of visitoer were satisfide.Following to that, the dissatisfide ratio were 40%. Then after 10% shows the overly dissatisfied tourist. lastly the 5% percentage of visitor have no response.Now coming on to the year after refurbishment, the 35% of ratio project the extremely satisfied visites. Then, 40% percentage of traveler were satisfied. Where, the proportion of dissatisfide visitors were 15%. Following to that, there were 5% percentage for the very dissatisfied as well as for no response.
Overall, it can be seen that thw ratio of dissatisfied visitor were same for the both time periods more over the fraction of highly dissatisfied tourists were reduce after the year.
AI examiner evaluation
| Criterion | Band |
|---|---|
| Task Achievement / Task Response | 5.5 |
| Coherence and Cohesion | 6.0 |
| Lexical Resource | 5.0 |
| Grammatical Range and Accuracy | 5.0 |
| Overall | 5.5 |
Task Achievement / Task Response: Band 5.5
You report the main visitor totals accurately (74,000 before and 92,000 after) and include the satisfaction figures for both periods, so the response covers the table and charts. However, the overview is unclear and contains a key factual error: dissatisfaction did not stay the same; it fell from 40% to 15%. The reduction in very dissatisfied visitors from 10% to 5% is correctly noted, but the overview should also highlight the rise in satisfied and very satisfied responses, especially the increase in very satisfied visitors from 15% to 35%. Some details are presented as a list rather than compared, and the opening misidentifies the visitor total as a “proportion.” A clearer overview of the main changes, supported by direct comparisons, would make the report more complete.
Coherence and Cohesion: Band 6.0
The response has a recognisable structure: an introduction, a paragraph on visitor numbers, a paragraph covering survey results, and a concluding overview. This makes the information broadly easy to follow. However, progression within the survey paragraph is mechanical, with repeated transitions such as “Along with,” “Following to that,” and “Then,” and the long sequence of figures reads more like a list than a comparison. The final overview also conflicts with the figures already reported, making the relationship between the detail and conclusion unclear. Use fewer, more precise linking expressions and group the results by meaningful trends—for example, compare positive responses before and after, then compare negative responses. This would strengthen the flow and referencing.
Lexical Resource: Band 5.0
You use some task-relevant vocabulary, including “refurbishment,” “satisfied,” “dissatisfied,” “ratio,” and “proportion,” and the reader can generally identify the categories being described. However, the range is limited and several choices are inaccurate or repetitive. “Proportion of tourist” does not describe the total number of visitors, while “explorer” is not an appropriate substitute for visitors. Phrases such as “the 35% of ratio project” and “overly dissatisfied tourist” are also unnatural or unclear. Spelling errors—including “satisfide,” “visitores,” and “dissatisfide”—are noticeable and sometimes slow understanding. Aim for precise chart language such as “the percentage of respondents” and “the number of visitors,” and check spelling and collocations carefully.
Grammatical Range and Accuracy: Band 5.0
You attempt both simple and longer sentence forms, and the response is usually understandable. However, control is inconsistent, particularly in sentence openings and clauses: “The given chart illustrate” has subject–verb disagreement, while “On the second chart the there were result” is not a well-formed sentence. Articles and plural forms are also often missing or mismatched, as in “the year before refurbishment” and “the 5% percentage of visitor have no response.” Punctuation and capitalisation are unreliable, especially in the opening and where sentences run together. These recurring errors can make the reader pause to interpret the data. Practise building accurate subject–verb sentences first, then add comparisons using controlled clauses such as “while” or “whereas.”
See this exact question answered at other band scores. The same prompt compared across bands.
Browse more IELTS Writing model answers or get your own writing scored by the same AI examiner.