Band 5.0 IELTS Writing Task 1 Model Answer
Overall Band Score: 5.0 · Cambridge IELTS 11 · 2026-11-20
IELTS Writing Task 1 question
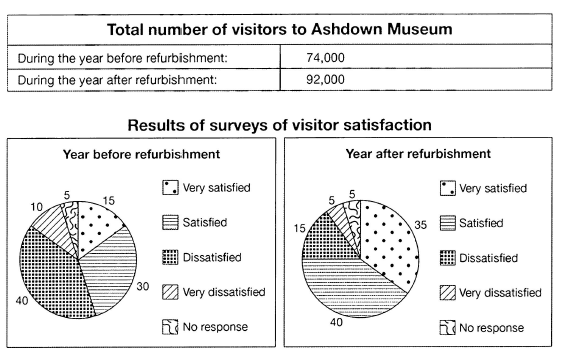
The table below shows the numbers of visitors to Ashdown Museum during the year before and the year after it was refurbished. The charts show the result of surveys asking visitors how satisfied they were with their visit, during the same two periods.
Summarise the information by selecting and reporting the main features, and make comparisons where relevant.
Student answer (Band 5.0)
The given table describes about the number of visitors to Ashdown museum before and after it was refurbished
The charts shows the result about the satisfaction of the visitors during both the periods
The charts shows that there is a slight increase in the number of visitors before it was 74000 but after refurbished it got increased to 92000
number of satisfied visitors were only 15 in the previous year we can observe a drastic increase by 35 people who were ver satisfied
30 people were satisfied by the survey previously in the next year more 10 people were also satisfied .
large number of people were dissatisfied before renovation but after getting renovated the number of people got decreased who were not satisfied again the people who were bery dissatisfied also got declined after refurbishedment the people with no response remained same in both the year.
hence the given charts shows that much more people were attracted towards the museum afyer refurbishedment
AI examiner evaluation
| Criterion | Band |
|---|---|
| Task Achievement / Task Response | 5.5 |
| Coherence and Cohesion | 4.5 |
| Lexical Resource | 5.0 |
| Grammatical Range and Accuracy | 5.0 |
| Overall | 5.0 |
Task Achievement / Task Response: Band 5.5
You identify the main overall changes: visitor numbers rose from 74,000 to 92,000, satisfaction improved, and the no-response share stayed the same. These are relevant features and the conclusion that more people were attracted after refurbishment is broadly supported. However, some figures are misinterpreted: the chart gives percentages, not numbers of people, so “35 people” and “10 people” should be reported as percentages. The account also does not clearly compare all satisfaction categories with their exact values; for example, dissatisfaction fell from 40% to 15%, while very dissatisfaction fell from 10% to 5%. A clearer overview and more precise reporting of the survey results would make the response more complete.
Coherence and Cohesion: Band 4.5
The response follows a basic order, introducing the table and charts before describing visitor numbers and survey results, and it ends with a summary. However, the ideas are not separated into clear paragraphs, and the progression within the survey description is difficult to follow. The long section beginning “large number of people were dissatisfied” combines several categories in one sentence, making the comparisons hard to track. Linking phrases such as “hence” and “but” are used, but connections between individual figures are often unclear or repetitive. Organise the response into an introduction, an overview, and focused detail paragraphs, and use explicit comparisons such as “by contrast” or “while” to guide the reader.
Lexical Resource: Band 5.0
You use some relevant vocabulary for describing the charts, including “increase,” “decreased,” “satisfied,” and “dissatisfied,” so the main topic is generally understandable. However, the range is limited and several expressions are inaccurate or awkward, such as “the result about the satisfaction,” “got increased,” and “people were attracted towards the museum.” Spelling errors, including “ver,” “bery,” and “afyer,” also reduce clarity. Use precise chart language and avoid repeating “people” when describing percentages. For example, refer to “the proportion of visitors” and say that satisfaction “rose” or dissatisfaction “declined.” Greater accuracy in word choice and spelling would make the report more natural and precise.
Grammatical Range and Accuracy: Band 5.0
The response attempts both simple and longer sentence forms, but control is inconsistent, and errors frequently affect readability. Examples include “The charts shows,” where the subject and verb do not agree, and “before it was 74000 but after refurbished it got increased,” which has faulty sentence structure and verb forms. Articles and prepositions are also often missing or misplaced, as in “during both the periods” and “after refurbished.” Punctuation is limited, with several ideas joined into long sentences. Build accurate short sentences first, then combine related comparisons using controlled clauses. Check subject–verb agreement, past-tense forms, and sentence boundaries during revision.
See this exact question answered at other band scores. The same prompt compared across bands.
Browse more IELTS Writing model answers or get your own writing scored by the same AI examiner.