Band 6.0 IELTS Writing Task 1 Model Answer
Overall Band Score: 6.0 · Cambridge IELTS 11 · 2026-11-21
IELTS Writing Task 1 question
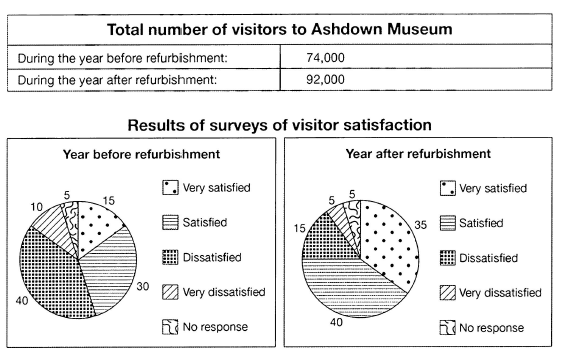
The table below shows the numbers of visitors to Ashdown Museum during the year before and the year after it was refurbished. The charts show the result of surveys asking visitors how satisfied they were with their visit, during the same two periods.
Summarise the information by selecting and reporting the main features, and make comparisons where relevant.
Student answer (Band 6.0)
The table illustrates the total number of visitors to Ashdown Musuem during the year before and after it was refurbished. Furthermore, the chart comprises the survery results asking visitors about their satisfaction before and after the refurbishment.
Overall, the total number of visitors to Ashdown Musuem were higher after refurbishment than before refurbishment. Furthermore, public seemed very satisfied after the refurbishment as their were more people dissatisfied before refurbishment.
People visiting Ashdown Museum seemed more dissatisfied before the refurbishment with 40% of total visitors. The second largest number of people were very dissatisfied as of 30%, followed by 10% people who were satisfied, only 15% of tourists very very satisfied, and the remaining 5% of 74,000 visitors reported no response.
Visitors seemed more satisfied after refurbishment as the number of visitors grew from 74,000 to 92,000 after refurbishment. Moreover, 40% of visitors were satisfied , the second largest number of pople were very satisfied as of 35%, followed by 15% people who were dissatisfied, the tally of very dissatisfied plumeted by half from 10% to 5%. Moreover, as the number of visitors grew so the number of no survey responses accordingly.
AI examiner evaluation
| Criterion | Band |
|---|---|
| Task Achievement / Task Response | 6.5 |
| Coherence and Cohesion | 6.5 |
| Lexical Resource | 6.0 |
| Grammatical Range and Accuracy | 5.5 |
| Overall | 6.0 |
Task Achievement / Task Response: Band 6.5
You cover both the visitor totals and the satisfaction surveys, and your overview identifies the main changes: attendance rose from 74,000 to 92,000, while satisfaction improved after refurbishment. Most figures are reported accurately, including the 40% dissatisfied before and the 40% satisfied after. However, one important category is misreported: before refurbishment, 30% were satisfied and 10% were very dissatisfied, not the reverse. The final claim that no-response numbers rose “accordingly” is also unsupported, since the proportion stayed at 5% in both years. The response therefore selects relevant features and gives a clear overall picture, but some details are inaccurate or insufficiently developed. Check each category against the chart and distinguish percentages from visitor totals.
Coherence and Cohesion: Band 6.5
The response has a coherent overall arrangement: an introduction, an overview, and separate paragraphs describing the two periods. This makes the comparison easy to follow, and linking expressions such as “Overall,” “Moreover,” and “followed by” help signal relationships between points. However, “Furthermore” is repeated in the opening and overview, and the final paragraph uses “Moreover” twice, making cohesion somewhat mechanical. Some references are also unclear: “the second largest number” does not specify the category, while “as the number of visitors grew so the number of no survey responses accordingly” leaves the relationship difficult to interpret. Use clearer category labels and vary or reduce linking phrases so that the data, rather than connectors, guides the progression.
Lexical Resource: Band 6.0
You use an adequate range of vocabulary for describing the table and charts, including “total number,” “satisfaction,” “dissatisfied,” and “grew.” There are also attempts at more varied wording, such as “tally” and “plummeted,” although the latter is too strong for a change from 10% to 5%. Several spelling errors—“Musuem,” “survery,” and “pople”—and awkward or inaccurate expressions reduce precision. “Very very satisfied” is not the chart’s category label, and “the second largest number of people were very dissatisfied as of 30%” is both unclear and based on a misread figure. Aim for accurate chart terminology and natural collocations, and proofread spelling before submitting.
Grammatical Range and Accuracy: Band 5.5
You attempt a mix of simple and more complex sentence forms, including clauses introduced by “as” and “with,” and the main meaning is generally understandable. Some grammatical errors remain. For example, “the total number … were higher” has a subject–verb agreement problem; “their were more people” uses the wrong form; and “the second largest number of people were” has an awkward agreement pattern. The final sentence, “as the number of visitors grew so the number of no survey responses accordingly,” is structurally incomplete and lacks a clear verb in its second clause. There are also punctuation and spacing slips around commas. Build accuracy by checking each sentence for a complete clause, correct agreement, and a clear relationship between clauses.
See this exact question answered at other band scores. The same prompt compared across bands.
Browse more IELTS Writing model answers or get your own writing scored by the same AI examiner.