Band 6.0 IELTS Writing Task 1 Model Answer
Overall Band Score: 6.0 · Cambridge IELTS 11 · 2026-11-05
IELTS Writing Task 1 question
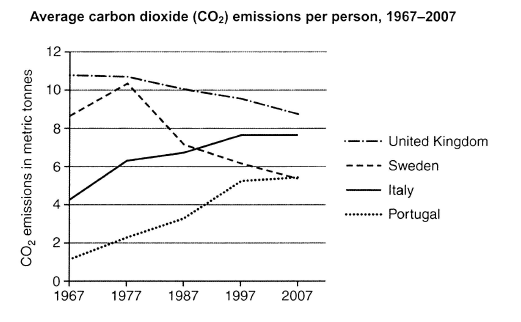
The graph below shows average carbon dioxide (CO2) emissions per person in the United Kingdom, Sweden, Italy and Portugal between 1967 and 2007.
Summarise the information by selecting and reporting the main features, and make comparisons where relevant.
Student answer (Band 6.0)
The line graph compares the average carbon dioxide(CO2) emission per person across 4 different nations betweeen the year 1967 to 2007.
Overall, it is evident, the carbon emission decreased in the year 2007, while in 1967, the most carbon emission happened person.
The nation with most carbon emission was United Kingdom, in 1967, approximately 11 metric tons; but it showed a steady decline and became approximately 8.5 metric tons. Sweden, on the other hand, showed a surge increase to approximately 10.1 metric tons from 8 metric tons; but in the later years there was a sharp plummet and it came to approx. 5 metricx tons.
Conversely, Italy and Portugal were the lowest in 1967, 4 and 1 metric tons respectively; they jumped to 6.1 and 2.1 metric tons respectively in the year 1977 and showed a graduall increase in the other years and finally stood in 8 and 5 mtric tons (aprrox.) respectively.
AI examiner evaluation
| Criterion | Band |
|---|---|
| Task Achievement / Task Response | 6.0 |
| Coherence and Cohesion | 6.0 |
| Lexical Resource | 5.5 |
| Grammatical Range and Accuracy | 5.5 |
| Overall | 6.0 |
Task Achievement / Task Response: Band 6.0
You identify the four countries and report the main broad patterns: UK emissions declined, Sweden rose before falling, and Italy and Portugal increased. The figures are generally close to the chart, including the UK’s fall from about 11 to 8.5 tonnes and Portugal’s rise from roughly 1 to 5. However, the overview is unclear and partly inaccurate: “the carbon emission decreased in the year 2007” suggests a general fall, although Italy’s figure levelled off and Portugal continued rising. The comparison that the UK was highest in 1967 is useful, but the response does not clearly state that it remained highest in 2007, while Italy finished above Sweden. Make the overview more precise and distinguish the countries’ different end-of-period patterns.
Coherence and Cohesion: Band 6.0
The response has a recognisable structure: an introduction, an overview, and two groups of country details. This gives the reader a coherent overall route through the information, and linking expressions such as “on the other hand” and “Conversely” help signal comparisons. However, the overview does not clearly summarise the main contrasts, and some connections are awkward or unclear, particularly “while in 1967, the most carbon emission happened person.” The final sentence also combines several years and figures in a way that makes the progression harder to follow. Use clearer topic sentences and organise the details by trend—for example, the declining UK and Sweden together, then the rising Italy and Portugal—with explicit comparisons at the end.
Lexical Resource: Band 5.5
You use a reasonable range of trend vocabulary, including “steady decline,” “surge,” “sharp plummet,” and “gradual increase,” which helps describe changes rather than merely list figures. Some choices, however, are inaccurate or unnatural for this chart. “Surge increase” is redundant, “carbon emission” is better expressed as “CO₂ emissions,” and “the most carbon emission happened person” does not communicate the intended comparison clearly. There are also spelling errors such as “betweeen,” “metricx,” “mtric,” and “aprrox.” These do not prevent the reader from understanding the main trends, but they reduce precision and polish. Prefer standard chart language and check spelling carefully before submitting.
Grammatical Range and Accuracy: Band 5.5
You attempt a mix of sentence forms, including contrast clauses with “while,” “but,” and “on the other hand,” and most of the intended comparisons can be understood. Some grammatical errors remain, especially in the overview and in longer sentences. For example, “the most carbon emission happened person” has an unclear sentence structure, while “the carbon emission decreased in the year 2007” uses an awkward singular construction and does not express the trend accurately. The opening also needs a more natural time phrase: “between 1967 and 2007.” Improve control of articles, plural forms, and clause structure, and avoid joining several comparisons with semicolons when the relationships are not fully clear.
See this exact question answered at other band scores. The same prompt compared across bands.
Browse more IELTS Writing model answers or get your own writing scored by the same AI examiner.