Band 6.0 IELTS Writing Task 1 Model Answer
Overall Band Score: 6.0 · Cambridge IELTS 11 · 2026-11-05
IELTS Writing Task 1 question
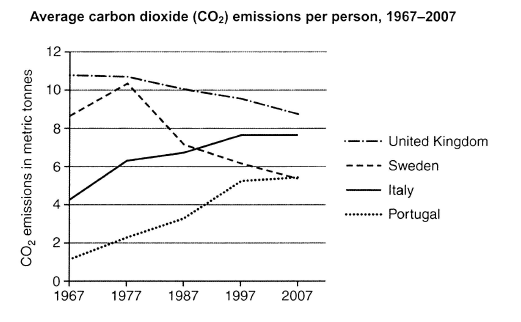
The graph below shows average carbon dioxide (CO2) emissions per person in the United Kingdom, Sweden, Italy and Portugal between 1967 and 2007.
Summarise the information by selecting and reporting the main features, and make comparisons where relevant.
Student answer (Band 6.0)
The graph shows the comparison of emission of CO2 per person in United Kingdom, sweden, italy and portugal in 1967 to 2007. On comparison the graph shows that United kingdom emitts 10-12 metric tonnes of CO2 which is at the larger scale as compared to other countries whereas portugal emitts lower proportion of CO2 amongst all.
United Kingdom is at peak emitting around 11 metric tonn of CO2 however the graph shows decline in the emmision after 1977 and after that it kept declining while still remaining the major country that emitts higher proportion of CO2 as compared to other listed countries.
Sweden in 1967 emitted 8-10 metric tonnes of CO2 and after that it kept surging till 1977 after that the graphs shows a sudden decline till 1987 reaching to 6-8 metric tonnes from 8-10 metric tonnes. After 1987 the graphs kept declining until 2007 reaching aroung 4-6 metric tonnes emission of CO2.
Italy initially in 1967 emitted CO2 around 4-6 metric tonnes after that the graph kept rising till 2007 reaching around 6-8 metric tonnes of CO2 emission.
Portugal in 1967 emitted around 0-2 metric tonnes of CO2 which is lowest amongst all. After that it gradually starts increasing till 1997reaching 4-6 metric tonnes of emission and remain on that same till 2007.
Overall United kingdom is the major of all countries emitting alot of CO2 while portugal remains at lowest from start, increased gradually and meeting italy at a point having emission around 4-6 metric tonnes.
AI examiner evaluation
| Criterion | Band |
|---|---|
| Task Achievement / Task Response | 6.5 |
| Coherence and Cohesion | 6.5 |
| Lexical Resource | 5.5 |
| Grammatical Range and Accuracy | 5.5 |
| Overall | 6.0 |
Task Achievement / Task Response: Band 6.5
You identify the main overall pattern: the UK remains the highest emitter while Portugal starts lowest and rises, and you describe Sweden’s rise to 1977 followed by a decline. The country-by-country coverage is relevant, and the overview also notes Portugal’s convergence with Italy. Some details, however, are imprecise or incomplete: the UK begins at about 10.8 tonnes rather than a broad 10–12 range, and Italy levels off at about 7.6 tonnes from 1997 to 2007 rather than simply continuing to rise. The claim that Portugal meets Italy is also inaccurate; Portugal reaches roughly the same level as Sweden in 2007, while Italy remains higher. More precise comparisons and key endpoint figures would strengthen the report.
Coherence and Cohesion: Band 6.5
The response has a clear overall arrangement: an introduction and overview are followed by paragraphs describing each country, with a final summary. This makes the information easy to locate, and sequencing within the Sweden and Portugal descriptions is generally chronological. However, the repeated country-by-country pattern and phrases such as “after that” make progression somewhat mechanical. The final overview repeats earlier points rather than drawing together the most useful comparison, and “meeting Italy at a point” is unclear because the lines do not meet. Use a more comparative grouping—for example, the declining UK and Sweden against the rising Italy and Portugal—and vary linking expressions to make relationships between trends clearer.
Lexical Resource: Band 5.5
You use relevant topic vocabulary, including “metric tonnes,” “decline,” “surging,” and “gradually,” so the reader can follow the general trends. However, the range and control are uneven, with repeated reliance on “emits,” “graph,” “after that,” and “around.” Several choices are inaccurate or unnatural: “at the larger scale” does not clearly express that the UK has the highest emissions, and “major country” is not an appropriate way to describe the largest emitter. Spelling errors such as “emmision,” “aroung,” and “alot” also reduce accuracy. Aim for precise trend language and standard collocations, such as “recorded the highest per-capita emissions” and “remained stable.”
Grammatical Range and Accuracy: Band 5.5
You attempt both simple and more extended sentences, including clauses linked with “while” and “after,” and the main meaning is usually understandable. However, control is inconsistent, particularly in long sentences joined by repeated “after that.” For example, “United Kingdom is at peak emitting” has an awkward grammatical construction, while “Portugal … starts increasing … and remain on that same” shifts tense and lacks a clear noun after “same.” Articles and sentence boundaries also need attention: use “the United Kingdom,” and separate the run-on sequence “after that it kept surging till 1977 after that…” into correctly punctuated sentences. More consistent past-tense reporting and shorter, accurately controlled complex sentences would improve clarity.
See this exact question answered at other band scores. The same prompt compared across bands.
Browse more IELTS Writing model answers or get your own writing scored by the same AI examiner.